

Introduction: The Importance of Model Monitoring and Management in Enterprise MLOps
In the era of AI-driven business, machine learning models are no longer just experimental tools—they are mission-critical assets powering everything from personalized recommendations to fraud detection and supply chain optimization. As organizations scale their ML initiatives, the need for robust model monitoring and management becomes paramount, especially in enterprise environments where reliability, compliance, and business impact are non-negotiable.
Why Model Monitoring Matters in Enterprise MLOps
Model monitoring is the continuous process of tracking the health, performance, and behavior of ML models in production. Unlike traditional software, ML models can degrade over time due to data drift, changing user behavior, or evolving business requirements. Without proactive monitoring, organizations risk silent failures, biased predictions, and costly business disruptions. Enterprise-grade monitoring goes beyond simple accuracy checks—it includes tracking data quality, feature distributions, latency, throughput, and business KPIs, all in real time.
The Role of Model Management
Model management encompasses the full lifecycle of ML models: versioning, promotion, deployment, rollback, and retirement. In an enterprise setting, this means maintaining a central model registry, enforcing governance policies, and ensuring that only validated, approved models reach production. Effective model management enables teams to quickly roll back to previous versions if issues arise, audit every model change for compliance, and coordinate updates across distributed teams and environments.
Enterprise-Grade Requirements
At the enterprise level, model monitoring and management must address additional challenges:
Scale: Managing hundreds or thousands of models across multiple business units and geographies.
Security and Compliance: Enforcing access controls, audit trails, and regulatory requirements (e.g., GDPR, HIPAA).
Collaboration: Supporting seamless workflows between data scientists, ML engineers, DevOps, and business stakeholders.
Automation: Integrating monitoring and management with CI/CD pipelines for rapid, reliable deployments.
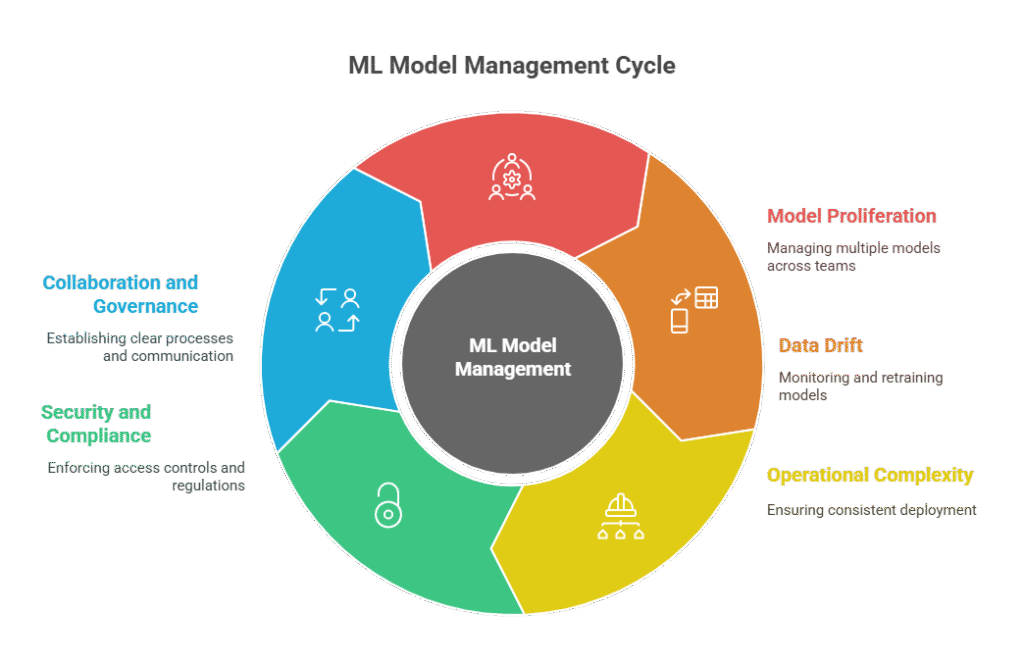
Key Challenges of Managing ML Models at Scale
Managing machine learning models at scale in an enterprise environment presents a unique set of challenges that go far beyond those faced in small-scale or research settings. As organizations deploy hundreds or even thousands of models across multiple business units, regions, and use cases, the complexity of monitoring, maintaining, and governing these models increases exponentially.
Model Proliferation and Version Control
One of the biggest challenges is model proliferation. Enterprises often have multiple teams developing similar models for different products, markets, or customer segments. Without a centralized model registry and strict version control, it becomes nearly impossible to track which model is in production, which version is the latest, and how each model was trained. This can lead to duplicated effort, inconsistent results, and increased risk of deploying outdated or unvalidated models.
Data Drift and Model Degradation
In production, models are exposed to real-world data that can change over time—a phenomenon known as data drift. As input data distributions shift, model performance can silently degrade, leading to inaccurate predictions and business losses. Detecting and responding to drift at scale requires automated monitoring, alerting, and retraining workflows that can handle large numbers of models simultaneously.
Operational Complexity and Infrastructure Management
Enterprises must manage diverse infrastructure environments, including on-premises data centers, multiple cloud providers, and edge devices. Ensuring that models are deployed, monitored, and updated consistently across all these environments is a significant operational challenge. Automated CI/CD pipelines, containerization, and orchestration tools are essential for maintaining consistency and reliability.
Security, Compliance, and Auditability
With increased scale comes greater responsibility for security and compliance. Enterprises must enforce strict access controls, maintain detailed audit logs, and ensure that all model deployments comply with industry regulations (such as GDPR, HIPAA, or SOX). Failing to do so can result in data breaches, regulatory penalties, and reputational damage.
Collaboration and Governance
As ML teams grow, collaboration and governance become critical. Organizations need clear processes for model approval, promotion, and rollback, as well as transparent communication between data scientists, ML engineers, DevOps, and business stakeholders. Without strong governance, models can be deployed without proper validation, or critical updates may be delayed due to miscommunication.
Core Metrics for Monitoring ML Models in Production
Monitoring machine learning models in production is essential for ensuring reliability, performance, and business value—especially at the enterprise level. Tracking the right metrics allows organizations to detect issues early, maintain compliance, and continuously improve their AI systems. Here are the core metrics every enterprise should monitor for ML models in production:
- Model Performance Metrics
Accuracy, Precision, Recall, F1-score: These classic metrics measure how well your model is performing on real-world data. For classification tasks, monitor not just overall accuracy but also class-specific metrics to catch imbalances or bias.
AUC-ROC, Log Loss, MAE, RMSE: For more nuanced evaluation, track metrics appropriate to your model type (e.g., regression, ranking, or probabilistic outputs).
- Data Drift and Feature Statistics
Feature Distribution Drift: Monitor changes in the distribution of input features compared to training data. Tools like Population Stability Index (PSI) or Kolmogorov-Smirnov tests can help detect drift.
Input Data Quality: Track missing values, outliers, and schema changes to ensure data integrity.
- Prediction and Serving Metrics
Prediction Latency: Measure the time taken for the model to return a prediction. High latency can degrade user experience and break SLAs.
Throughput: Track the number of predictions served per second/minute to ensure the system can handle production load.
Error Rates: Monitor failed predictions, exceptions, or timeouts to catch operational issues.
- Business and Custom KPIs
Business Impact Metrics: Connect model outputs to business outcomes, such as conversion rates, fraud detection rates, or revenue impact.
Custom Alerts: Set up alerts for business-specific thresholds, such as a sudden drop in approval rates or an unexpected spike in flagged transactions.
- Resource Utilization and Infrastructure Health
CPU, GPU, and Memory Usage: Monitor resource consumption to optimize costs and prevent bottlenecks.
System Health: Track uptime, container restarts, and infrastructure errors to ensure high availability.
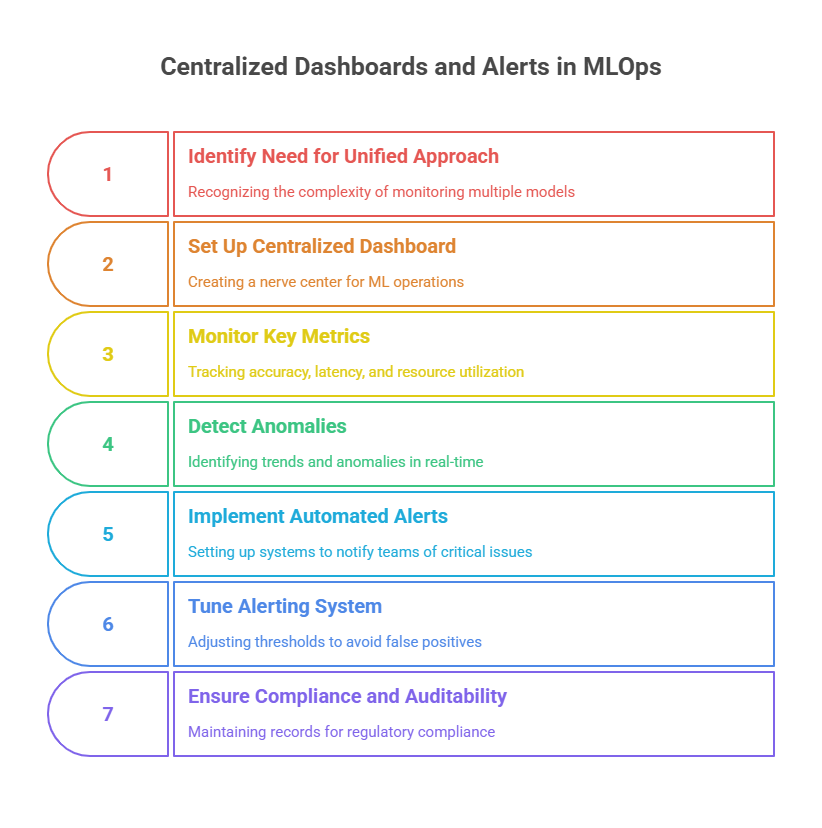
Setting Up Centralized Dashboards and Alerts
In enterprise-grade MLOps, setting up centralized dashboards and automated alerts is essential for maintaining visibility, reliability, and rapid response across all deployed machine learning models. As organizations scale their AI initiatives, the complexity of monitoring hundreds or thousands of models—often across multiple business units and cloud environments—demands a unified approach to observability.
A centralized dashboard acts as the nerve center for ML operations. It aggregates key metrics from all models and pipelines, providing a real-time, holistic view of system health, model performance, and business impact. With a well-designed dashboard, teams can monitor accuracy, latency, throughput, data drift, resource utilization, and business KPIs—all in one place. This enables data scientists, ML engineers, and business stakeholders to quickly spot trends, detect anomalies, and prioritize issues that require immediate attention.
Modern dashboards are built using tools like Grafana, Kibana, or cloud-native solutions such as AWS CloudWatch Dashboards, Azure Monitor, or Google Cloud Monitoring. These platforms support customizable panels, real-time updates, and integration with a wide range of data sources, including metrics, logs, and traces from both on-premises and cloud environments. By standardizing on a single dashboarding solution, organizations eliminate data silos and ensure that everyone is working from the same source of truth.
Automated alerts are the other half of the equation. In a large-scale ML environment, it’s impossible to manually monitor every metric or log entry. Automated alerting systems continuously evaluate metrics against predefined thresholds or anomaly detection algorithms. When a metric crosses a critical threshold—such as a sudden drop in model accuracy, a spike in prediction latency, or a data validation failure—the system instantly notifies the relevant teams via email, Slack, PagerDuty, or other incident management tools.
Effective alerting requires careful tuning to avoid both alert fatigue (too many false positives) and missed incidents (false negatives). Best practices include setting actionable thresholds, grouping related alerts to reduce noise, and regularly reviewing alert rules as models and business needs evolve. Some organizations also implement multi-level alerting, where minor issues trigger notifications for monitoring, while critical failures escalate to on-call engineers or trigger automated rollback procedures.
Centralized dashboards and alerts also play a key role in compliance and auditability. By maintaining a historical record of all metrics, incidents, and responses, organizations can demonstrate regulatory compliance, support post-incident reviews, and continuously improve their MLOps processes.
Model Versioning, Promotion, and Rollback Strategies
In enterprise-grade MLOps, model versioning, promotion, and rollback strategies form the backbone of reliable machine learning operations. As organizations deploy hundreds or thousands of models across multiple environments, having a systematic approach to managing model lifecycles becomes critical for maintaining quality, ensuring reproducibility, and minimizing downtime when issues arise.
Model versioning begins with establishing a centralized model registry that tracks every iteration of each model along with comprehensive metadata. This includes the exact version of training data used, code commit hashes, hyperparameters, training environment details, and validation metrics. By maintaining this detailed lineage, teams can reproduce any model version, compare performance across iterations, and understand exactly how each model was created. This level of traceability is essential not only for debugging and optimization but also for regulatory compliance in industries like finance and healthcare.
The promotion process typically follows a structured pathway from development through staging to production. In the staging environment, models undergo rigorous testing with production-like data and infrastructure to validate their performance, latency, and resource requirements. Only models that pass predefined quality gates—such as minimum accuracy thresholds, maximum latency limits, or bias detection checks—are eligible for promotion to production. Many enterprises implement automated promotion workflows that trigger based on performance metrics, while others require human approval for critical production deployments.
Deployment strategies play a crucial role in safe model promotion. Blue-green deployments allow teams to switch traffic between two identical production environments, enabling instant rollback if issues are detected. Canary deployments gradually route a small percentage of traffic to the new model while monitoring its performance, scaling up only if metrics remain stable. A/B testing frameworks can run multiple model versions simultaneously, comparing their business impact before making final deployment decisions.
Rollback capabilities are the safety net that enables teams to move fast while maintaining reliability. When monitoring systems detect performance degradation, data drift, or unexpected behavior, automated rollback procedures can instantly revert to the previous stable model version. This requires maintaining not just the model artifacts but also their complete runtime environments, including preprocessing pipelines, feature transformations, and serving configurations.
Here’s a practical Python example demonstrating a simplified model versioning and promotion system:
python

from enum import Enum

from dataclasses import dataclass

from datetime import datetime

from typing import Optional, Dict, List

class ModelStage(Enum):

    DEVELOPMENT = "development"

    STAGING = "staging"

    PRODUCTION = "production"

    ARCHIVED = "archived"

@dataclass

class ModelVersion:

    name: str

    version: str

    accuracy: float

    latency_ms: float

    stage: ModelStage

    created_at: datetime

    previous_production_version: Optional[str] = None

class EnterpriseModelRegistry:

    def __init__(self):

        self.models: Dict[str, ModelVersion] = {}

        self.quality_gates = {

            ModelStage.STAGING: {"min_accuracy": 0.80, "max_latency_ms": 100},

            ModelStage.PRODUCTION: {"min_accuracy": 0.85, "max_latency_ms": 50}

        }

    def register_model(self, model: ModelVersion):

        """Register a new model version"""

        key = f"{model.name}:{model.version}"

        self.models[key] = model

        print(f"✅ Registered {key} in {model.stage.value}")

    def promote_model(self, name: str, version: str, target_stage: ModelStage) -> bool:

        """Promote model to target stage with quality gate validation"""

        key = f"{name}:{version}"

        if key not in self.models:

            print(f"❌ Model {key} not found")

            return False

        model = self.models[key]

        # Check quality gates

        if target_stage in self.quality_gates:

            gates = self.quality_gates[target_stage]

            if model.accuracy < gates["min_accuracy"]:

                print(f"❌ Promotion failed: accuracy {model.accuracy:.3f} < {gates['min_accuracy']}")

                return False

            if model.latency_ms > gates["max_latency_ms"]:

                print(f"❌ Promotion failed: latency {model.latency_ms}ms > {gates['max_latency_ms']}ms")

                return False

        # Handle production promotion

        if target_stage == ModelStage.PRODUCTION:

            current_prod = self._get_production_model(name)

            if current_prod:

                # Archive current production model

                current_prod.stage = ModelStage.ARCHIVED

                model.previous_production_version = current_prod.version

                print(f"📦 Archived previous production version: {current_prod.version}")

        # Promote model

        model.stage = target_stage

        print(f"🚀 Promoted {key} to {target_stage.value}")

        return True

    def rollback_model(self, name: str) -> bool:

        """Rollback to previous production version"""

        current_prod = self._get_production_model(name)

        if not current_prod or not current_prod.previous_production_version:

            print(f"❌ No rollback version available for {name}")

            return False

        # Find previous version

        prev_key = f"{name}:{current_prod.previous_production_version}"

        if prev_key not in self.models:

            print(f"❌ Previous version {prev_key} not found in registry")

            return False

        prev_model = self.models[prev_key]

        # Perform rollback

        current_prod.stage = ModelStage.ARCHIVED

        prev_model.stage = ModelStage.PRODUCTION

        print(f"🔄 Rolled back {name} to version {prev_model.version}")

        return True

    def _get_production_model(self, name: str) -> Optional[ModelVersion]:

        """Get current production model for given name"""

        for model in self.models.values():

            if model.name == name and model.stage == ModelStage.PRODUCTION:

                return model

        return None

    def list_models_by_stage(self, stage: ModelStage) -> List[ModelVersion]:

        """List all models in a specific stage"""

        return [m for m in self.models.values() if m.stage == stage]

# Demo usage

def demo_enterprise_model_lifecycle():

    registry = EnterpriseModelRegistry()

    # Register model versions

    model_v1 = ModelVersion("fraud_detector", "1.0", 0.82, 45, ModelStage.DEVELOPMENT, datetime.now())

    model_v2 = ModelVersion("fraud_detector", "1.1", 0.87, 40, ModelStage.DEVELOPMENT, datetime.now())

    model_v3 = ModelVersion("fraud_detector", "1.2", 0.83, 60, ModelStage.DEVELOPMENT, datetime.now())

    registry.register_model(model_v1)

    registry.register_model(model_v2)

    registry.register_model(model_v3)

    # Promote through stages

    print("\n--- Promotion Workflow ---")

    registry.promote_model("fraud_detector", "1.0", ModelStage.STAGING)

    registry.promote_model("fraud_detector", "1.0", ModelStage.PRODUCTION)  # Should fail

    registry.promote_model("fraud_detector", "1.1", ModelStage.STAGING)

    registry.promote_model("fraud_detector", "1.1", ModelStage.PRODUCTION)  # Should succeed

    registry.promote_model("fraud_detector", "1.2", ModelStage.STAGING)

    registry.promote_model("fraud_detector", "1.2", ModelStage.PRODUCTION)  # Should fail (latency)

    # Demonstrate rollback

    print("\n--- Rollback Scenario ---")

    registry.rollback_model("fraud_detector")

    # Show current state

    print("\n--- Current Production Models ---")

    prod_models = registry.list_models_by_stage(ModelStage.PRODUCTION)

    for model in prod_models:

        print(f"🚀 {model.name}:{model.version} (accuracy: {model.accuracy:.3f})")

if __name__ == "__main__":

    demo_enterprise_model_lifecycle()
Automated Model Retraining and Lifecycle Management
Automated model retraining and lifecycle management are essential for maintaining high-performing, reliable machine learning systems in enterprise environments. As data evolves and business requirements change, models can quickly become outdated or less effective. Without automation, keeping models fresh and compliant at scale is nearly impossible.
Why Automate Model Retraining?
In production, models are exposed to new data distributions, user behaviors, and external factors that can cause performance to degrade—a phenomenon known as data drift or concept drift. Automated retraining pipelines monitor model performance and data quality in real time, triggering retraining jobs when metrics fall below defined thresholds or when significant drift is detected. This ensures that models remain accurate, relevant, and aligned with business goals.
Lifecycle Management: Beyond Retraining
Lifecycle management encompasses the entire journey of a model, from initial development and deployment to monitoring, retraining, promotion, and eventual retirement. Automated workflows handle:
Model registration and versioning: Every retrained model is registered with full metadata, lineage, and performance metrics.
Promotion and rollback: Only validated models are promoted to production, and automated rollback procedures are in place if new models underperform.
Archiving and deprecation: Outdated or superseded models are archived, ensuring compliance and reducing operational risk.
How It Works in Practice
A typical automated retraining pipeline includes:
Continuous monitoring of model performance and data drift.
Triggering retraining when thresholds are breached or on a regular schedule.
Automated data validation and feature engineering for new training data.
Model training, evaluation, and registration in a central registry.
Automated promotion to staging or production if the new model outperforms the current one.
Rollback and alerting if issues are detected post-deployment.
Short Python Example: Automated Retraining Trigger
python

def should_retrain(current_accuracy, baseline_accuracy, drift_score, acc_threshold=0.85, drift_threshold=0.1):

    if current_accuracy < acc_threshold or drift_score > drift_threshold:

        print("Triggering automated retraining...")

        return True

    print("Model is healthy. No retraining needed.")

    return False

# Example usage

should_retrain(current_accuracy=0.82, baseline_accuracy=0.90, drift_score=0.15)
Best Practices
Integrate retraining triggers with your monitoring and model registry systems.
Automate validation and promotion steps to minimize manual intervention.
Maintain detailed audit trails for all retraining and deployment actions.
Regularly review retraining frequency and thresholds to balance freshness and resource usage.
Integrating Monitoring with CI/CD and Model Registry
Integrating monitoring with CI/CD pipelines and the model registry is a cornerstone of enterprise-grade MLOps. This integration ensures that every model version is not only tested and deployed automatically, but also continuously observed for performance, reliability, and compliance throughout its lifecycle. In large organizations, where dozens or hundreds of models may be deployed across multiple environments, this approach is essential for maintaining control, reducing risk, and accelerating innovation.
Why Integration Matters
When monitoring is tightly coupled with CI/CD and the model registry, teams gain end-to-end visibility and automation. Every time a new model is trained and registered, the CI/CD pipeline can automatically deploy it to a staging or production environment, set up monitoring dashboards, and configure alerts for key metrics such as accuracy, latency, drift, and resource usage. This closed feedback loop means that issues are detected early, and teams can respond rapidly—rolling back, retraining, or promoting models as needed.
How Integration Works in Practice
The integration typically starts with automated model validation in the CI/CD pipeline. As part of the build and test process, the pipeline evaluates the new model’s performance on holdout or shadow data, logs the results, and registers the model in the central registry with all relevant metadata. If the model meets predefined quality gates, it is automatically promoted to staging or production.
Once deployed, monitoring tools (such as Prometheus, Grafana, or cloud-native solutions) continuously track model and pipeline health. These tools are configured to collect metrics and logs for each model version, linking them back to the registry for full traceability. If a performance drop, data drift, or system error is detected, automated alerts are triggered. The CI/CD pipeline can then initiate a rollback to a previous model version, trigger retraining, or escalate the issue to the appropriate team.
Benefits of Integrated Monitoring
Rapid Incident Response: Automated alerts and rollback procedures minimize downtime and business impact.
Auditability and Compliance: Every deployment, metric, and incident is logged and linked to the model registry, supporting regulatory audits and internal reviews.
Continuous Improvement: Real-time feedback from monitoring informs retraining schedules, model selection, and pipeline optimization.
Collaboration: Data scientists, ML engineers, and DevOps teams work from a shared source of truth, streamlining communication and decision-making.
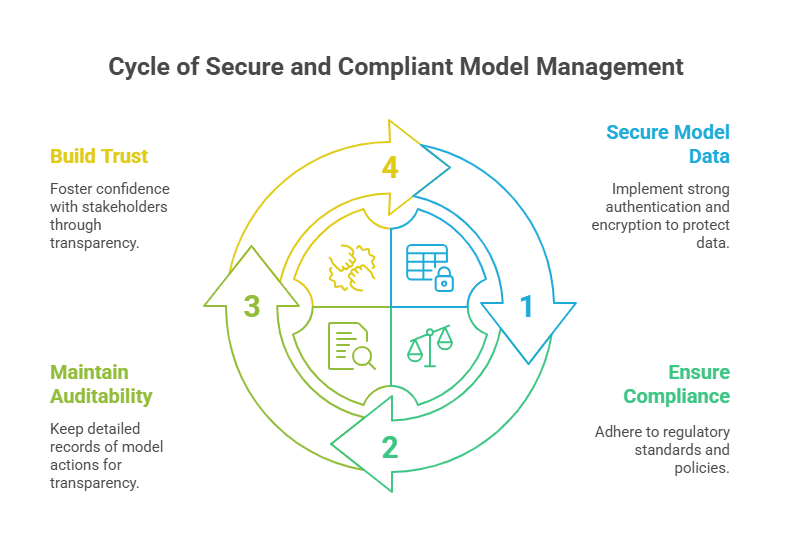
Security, Compliance, and Auditability in Model Management
Security, compliance, and auditability are foundational pillars of enterprise-grade model management in MLOps. As machine learning models become core business assets—often handling sensitive data and making high-stakes decisions—organizations must ensure that every aspect of the model lifecycle is protected, governed, and fully traceable.
Security in Model Management
Securing ML models and their associated data is critical to prevent unauthorized access, data breaches, and intellectual property theft. Enterprise MLOps platforms should enforce strong authentication and role-based access control (RBAC) for all model registry actions, including registration, promotion, deployment, and rollback. Encryption of model artifacts and metadata, both at rest and in transit, is essential. Integrating with enterprise identity providers (SSO, LDAP, OAuth) ensures centralized user management and access revocation when needed.
Compliance Requirements
Regulatory compliance is a top concern, especially in industries like finance, healthcare, and government. Organizations must ensure that models and data are handled in accordance with laws such as GDPR, HIPAA, or SOX. This includes maintaining data residency, enforcing data retention and deletion policies, and ensuring that only approved, validated models are deployed to production. Automated compliance checks in CI/CD pipelines can validate that models meet regulatory and ethical standards before promotion.
Auditability and Traceability
Auditability means having a complete, tamper-proof record of every action taken on models and data throughout their lifecycle. This includes who registered or updated a model, when it was promoted or rolled back, and what data and code were used for training. Detailed audit logs and lineage tracking are essential for regulatory audits, incident investigations, and internal reviews. They also support explainability and transparency, helping organizations build trust with stakeholders and regulators.
Incident Response and Root Cause Analysis for ML Failures
Incident response and root cause analysis are critical components of enterprise-grade MLOps, ensuring that machine learning systems remain reliable, trustworthy, and aligned with business goals. As organizations scale their AI deployments, the complexity of ML pipelines and the potential impact of failures increase. A well-defined incident response strategy and systematic root cause analysis process are essential for minimizing downtime, reducing risk, and continuously improving model performance.
Incident Response in ML Model Management
Incident response refers to the structured process of detecting, investigating, and resolving issues that affect ML models in production. These incidents can include sudden drops in model accuracy, data drift, pipeline failures, latency spikes, or security breaches. In enterprise environments, automated monitoring and alerting systems are configured to detect anomalies in real time and notify the appropriate teams.
A robust incident response plan includes:
Clear escalation paths: Define who is responsible for responding to different types of incidents (e.g., data scientists, ML engineers, DevOps, security).
Automated rollback procedures: Enable rapid reversion to a previous stable model version if a new deployment causes problems.
Incident runbooks: Provide step-by-step guides for common failure scenarios, ensuring a consistent and efficient response.
Communication protocols: Keep stakeholders informed about incident status, impact, and resolution steps.
Root Cause Analysis (RCA) for ML Failures
Root cause analysis is the process of identifying the underlying reason for an incident, rather than just addressing its symptoms. In ML systems, RCA often involves:
Reviewing monitoring data: Analyze metrics, logs, and traces to pinpoint when and where the failure occurred.
Validating data and model inputs: Check for data drift, schema changes, or corrupted inputs that may have triggered the issue.
Examining model and pipeline changes: Review recent code commits, model retraining events, or configuration updates.
Collaborating across teams: Involve data engineers, ML practitioners, and IT to ensure all potential causes are considered.
After identifying the root cause, teams should document findings, implement fixes, and update monitoring or validation checks to prevent recurrence. Blameless postmortems help foster a culture of continuous improvement and knowledge sharing.
Case Studies: Enterprise-Scale Model Monitoring in Action
Real-world case studies provide valuable insights into how leading organizations implement enterprise-scale model monitoring to ensure reliability, compliance, and business value from their machine learning systems. Here are a few examples that highlight best practices and lessons learned from large-scale deployments.
Case Study 1: Global Retailer – Real-Time Model Monitoring for Personalization
A global retailer deployed hundreds of recommendation models across multiple regions to personalize the shopping experience for millions of users. To manage this complexity, the company implemented a centralized monitoring platform using Prometheus and Grafana. They tracked model accuracy, latency, and data drift in real time, with automated alerts for any metric that crossed critical thresholds. When a sudden drop in conversion rates was detected, the monitoring system triggered an automated rollback to the previous model version, minimizing business impact and customer disruption.
Key Takeaways:
Centralized dashboards and real-time alerts are essential for managing large fleets of models.
Automated rollback procedures reduce downtime and protect business KPIs.
Continuous monitoring enables rapid detection and response to data drift and performance drops.
Case Study 2: Financial Services – Compliance-Driven Model Monitoring
A major financial institution needed to comply with strict regulatory requirements for credit risk models. They used cloud-native monitoring tools (AWS CloudWatch, Azure Monitor) integrated with their model registry and CI/CD pipelines. Every model deployment was automatically monitored for accuracy, fairness, and latency. Detailed audit logs and access controls ensured that only authorized personnel could view or modify monitoring data. Regular compliance reports were generated for internal and external audits.
Key Takeaways:
Integrating monitoring with CI/CD and model registry streamlines compliance and auditability.
Automated metric collection and reporting support regulatory requirements.
Fine-grained access control protects sensitive monitoring data.
Case Study 3: Healthcare – Incident Response and Patient Safety
A healthcare analytics company deployed ML models for patient risk prediction in hospitals. They set up real-time monitoring of model predictions, latency, and error rates using cloud-native and open source tools. When an anomaly was detected—such as a spike in prediction errors—an automated incident response workflow was triggered. This included alerting the on-call data science team, rolling back to a previous model, and logging the incident for postmortem analysis. This approach ensured patient safety and maintained trust with clinicians.
Key Takeaways:
Automated incident response and rollback are critical for high-stakes ML applications.
Real-time monitoring of prediction errors and latency protects end users.
Post-incident reviews drive continuous improvement and reliability.
Best Practices and Future Trends in Enterprise MLOps
As machine learning becomes a core driver of business value, enterprise MLOps is evolving rapidly. Organizations that succeed at scale do so by following best practices and staying ahead of emerging trends. Here’s what leading teams are doing—and what’s on the horizon for enterprise-grade model monitoring and management.
Best Practices for Enterprise MLOps
Automate Everything:
Automation is the backbone of scalable MLOps. From data validation and model training to deployment, monitoring, and retraining, automated pipelines reduce manual errors, accelerate delivery, and free up teams to focus on innovation.
Centralize Model Registry and Metadata:
Use a centralized model registry to track every model version, deployment, and associated metadata. This ensures full traceability, reproducibility, and compliance—especially important in regulated industries.
Integrate Monitoring with CI/CD:
Connect monitoring tools directly to your CI/CD pipelines and model registry. This enables real-time feedback, rapid rollback, and continuous improvement as models evolve.
Enforce Security and Compliance:
Implement strong access controls, encryption, and audit logging for all model and data assets. Automate compliance checks and maintain detailed audit trails to meet regulatory requirements.
Foster Cross-Functional Collaboration:
Break down silos between data science, engineering, DevOps, and business teams. Use shared dashboards, documentation, and regular reviews to align goals and accelerate problem-solving.
Continuously Monitor and Alert:
Set up real-time dashboards and automated alerts for key metrics—accuracy, drift, latency, and business KPIs. Regularly review and tune alert thresholds to minimize false positives and alert fatigue.
Document and Review Everything:
Maintain clear, up-to-date documentation for all pipelines, models, and monitoring setups. Conduct regular postmortems and reviews to learn from incidents and improve processes.
Future Trends in Enterprise MLOps
AI-Driven Automation:
Expect more intelligent automation in monitoring, retraining, and incident response—reducing manual intervention and speeding up resolution.
Unified Observability Platforms:
The next generation of tools will offer single-pane-of-glass dashboards for metrics, logs, traces, and model lineage across all environments (on-prem, cloud, edge).
Real-Time Explainability and Fairness Monitoring:
As regulations tighten, real-time explainability and bias detection will become standard features in enterprise MLOps stacks.
Edge and Federated MLOps:
With the rise of edge computing and federated learning, MLOps will extend to distributed, privacy-preserving deployments—requiring new approaches to monitoring and management.
Cost and Sustainability Optimization:
Future MLOps platforms will provide insights into resource usage, carbon footprint, and cost optimization, helping organizations balance performance, compliance, and sustainability.
Best Practices and Future Trends in Enterprise MLOps
As enterprise MLOps matures, organizations are discovering that success depends on a blend of technical rigor, automation, and cross-team collaboration. Here are the best practices and emerging trends that are shaping the future of enterprise-grade machine learning operations:
Best Practices
Automate the Entire ML Lifecycle:
From data ingestion and validation to model training, deployment, monitoring, and retraining, automation reduces manual errors, accelerates delivery, and ensures consistency at scale.
Centralize Model and Data Management:
Use a unified model registry and data catalog to track every version, deployment, and lineage. This centralization supports reproducibility, compliance, and rapid troubleshooting.
Integrate Monitoring and Alerting:
Connect monitoring tools directly to CI/CD pipelines and model registries. Real-time dashboards and automated alerts for accuracy, drift, latency, and business KPIs enable rapid response to issues.
Enforce Security and Compliance:
Implement strong access controls, encryption, and audit logging for all data and model assets. Automate compliance checks and maintain detailed audit trails to meet regulatory and ethical standards.
Foster Collaboration and Documentation:
Break down silos between data science, engineering, DevOps, and business teams. Use shared dashboards, regular reviews, and clear documentation to align goals and accelerate innovation.
Continuously Review and Improve:
Conduct regular postmortems, incident reviews, and pipeline audits. Use feedback loops to refine processes, update monitoring thresholds, and adopt new tools as the ecosystem evolves.
Future Trends
AI-Driven Automation and Self-Healing Pipelines:
Expect more intelligent automation in monitoring, retraining, and incident response, with pipelines that can detect and resolve issues autonomously.
Unified Observability and Governance Platforms:
Next-generation tools will offer single-pane-of-glass dashboards for metrics, logs, traces, and model lineage, supporting hybrid and multi-cloud environments.
Real-Time Explainability and Fairness Monitoring:
As regulations tighten, real-time explainability and bias detection will become standard, ensuring models are transparent, ethical, and compliant.
Edge and Federated MLOps:
With the growth of edge computing and federated learning, MLOps will extend to distributed, privacy-preserving deployments, requiring new approaches to monitoring and management.
Sustainability and Cost Optimization:
Future MLOps platforms will provide insights into resource usage, carbon footprint, and cost, helping organizations balance performance, compliance, and sustainability.
MLOps in Practice: Automation and Scaling of the Machine Learning Lifecycle
Monitoring ML models in production: tools, challenges, and best practices
Monitoring Models in Production – Tools and Strategies for 2025