

Introduction: Why Advanced Model Monitoring Matters
In today’s data-driven enterprises, deploying machine learning models to production is only the beginning of the journey. The real challenge starts after deployment, when models interact with ever-changing real-world data and business environments. This is why advanced ML model monitoring has become a critical component of modern MLOps pipelines.
Effective model monitoring ensures that machine learning models continue to deliver accurate, reliable, and fair predictions over time. Without robust monitoring, organizations risk model degradation, undetected data drift, compliance issues, and ultimately, business losses. Advanced monitoring goes beyond simple performance metrics—it encompasses drift detection, explainability, and automated retraining, forming the backbone of resilient and trustworthy AI systems.
Drift detection allows teams to identify when the data or relationships in the data have changed, which can silently erode model performance. Explainability provides transparency into model decisions, helping teams understand, debug, and build trust in AI-driven processes. Automated retraining ensures that models adapt to new patterns and maintain high performance without constant manual intervention.
Core Metrics for Monitoring ML Models
Monitoring machine learning models in production requires a clear understanding of which metrics truly reflect model health and business value. Choosing the right core metrics is essential for early detection of issues, maintaining model performance, and ensuring alignment with organizational goals.
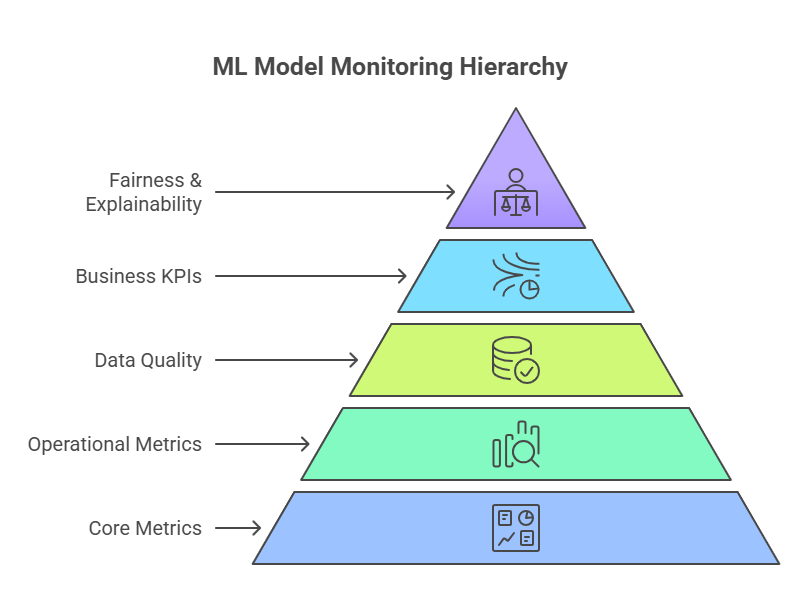
The most fundamental metrics include accuracy, precision, recall, and F1-score for classification tasks, or mean squared error (MSE) and mean absolute error (MAE) for regression. However, advanced model monitoring goes further, incorporating metrics that capture real-world performance and operational stability. These can include prediction latency, throughput, and resource utilization, which are crucial for models serving high-traffic applications.
Another key aspect is data quality metrics—such as missing values, outlier rates, and feature distribution changes—which help detect data drift before it impacts predictions. Business KPIs tied to model outcomes, like conversion rates or fraud detection rates, provide a direct link between model performance and organizational impact.
For regulated industries, fairness and bias metrics are increasingly important, ensuring that models do not inadvertently discriminate against certain groups. Explainability scores can also be tracked to monitor how transparent and interpretable model decisions remain over time.
In summary, effective ML model monitoring relies on a combination of technical, operational, and business-centric metrics. By continuously tracking these core indicators, organizations can quickly identify problems, maintain trust in AI systems, and drive better business outcomes.
Types of Drift: Data Drift vs. Concept Drift
Understanding the different types of drift is crucial for effective machine learning model monitoring and long-term model performance. The two most important categories are data drift and concept drift—both of which can silently degrade the accuracy and reliability of your ML models in production.
Data drift (also known as covariate shift) occurs when the statistical properties of the input data change over time. For example, if a model trained on customer data from one region is suddenly exposed to data from a new market, the distribution of features like age, income, or preferences may shift. This can lead to unexpected model behavior and reduced prediction quality. Detecting data drift early allows teams to investigate the root cause and take corrective action before business impact occurs.
Concept drift refers to changes in the underlying relationship between input features and the target variable. In other words, even if the input data looks similar, the way it relates to the outcome may evolve. For instance, in fraud detection, fraudsters may change their tactics, causing the patterns the model learned to become outdated. Concept drift is often more challenging to detect and address, as it requires monitoring not just the data, but also the model’s predictive performance and the real-world context.
Both data drift and concept drift can have significant consequences if left unchecked, including increased error rates, loss of business value, and compliance risks. That’s why advanced ML model monitoring solutions focus on detecting and distinguishing between these types of drift, enabling timely retraining and adaptation of models.
Methods for Detecting Drift in Production
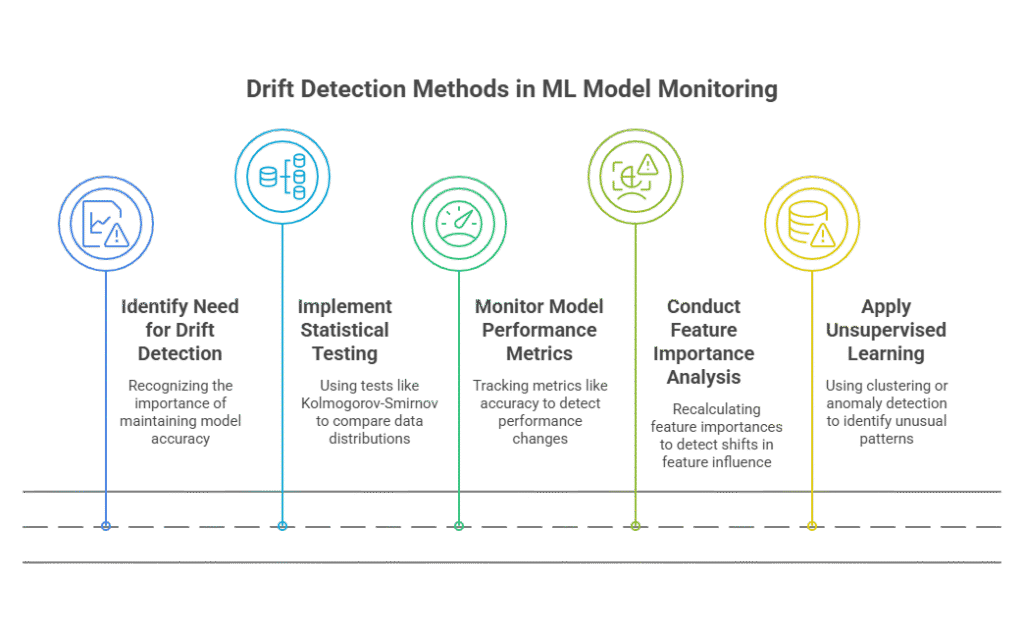
Detecting drift in production is a cornerstone of advanced ML model monitoring, ensuring that models remain accurate and relevant as data and business environments evolve. There are several proven methods for detecting drift that organizations can implement to safeguard their machine learning systems.
One of the most common approaches is statistical testing. Techniques like the Kolmogorov-Smirnov test, Population Stability Index (PSI), or Jensen-Shannon divergence can compare the distribution of incoming data to the original training data. These tests help identify significant changes in feature distributions, signaling potential data drift before it impacts model performance.
Another effective method is monitoring model performance metrics over time. By tracking metrics such as accuracy, precision, recall, or mean squared error on recent predictions, teams can spot sudden drops or gradual declines that may indicate concept drift. Integrating these checks into automated dashboards enables real-time alerts and faster response times.
Feature importance analysis is also valuable for drift detection. By regularly recalculating feature importances and comparing them to baseline values, teams can detect shifts in which features drive model predictions—often a sign of changing data relationships or concept drift.
For more advanced scenarios, unsupervised learning techniques like clustering or anomaly detection can flag unusual patterns in new data, even when labeled outcomes are unavailable. These methods are especially useful in dynamic environments where new types of data or behaviors frequently emerge.
Automated Retraining: When and How to Trigger Model Updates
Automated retraining is a key element of modern MLOps, ensuring that machine learning models stay accurate and relevant as data and business conditions change. Knowing when and how to trigger model updates is essential for maintaining high model performance and minimizing manual intervention.
The most common strategy is to set up performance-based triggers. By continuously monitoring core metrics such as accuracy, precision, recall, or business KPIs, organizations can define thresholds that, when breached, automatically initiate the retraining process. For example, if a model’s accuracy drops below a certain level, the system can start collecting new data, retrain the model, and redeploy it—all without human intervention.
Another effective approach is to use drift detection triggers. When statistical tests or monitoring tools detect significant data drift or concept drift, this can serve as an automated signal to retrain the model. This method ensures that models adapt quickly to changes in data distributions or relationships, reducing the risk of performance degradation.
Time-based retraining is also widely used, especially in environments where data evolves gradually. Organizations may schedule regular retraining cycles—such as weekly or monthly—regardless of detected drift, to ensure models are always up to date with the latest data.
For robust automation, it’s important to integrate retraining workflows with CI/CD pipelines and orchestration tools like Kubeflow, Airflow, or MLflow. This enables seamless data ingestion, model training, validation, and deployment, all governed by automated triggers and approval processes.
Explainability in Model Monitoring: Key Concepts
Explainability in model monitoring represents a critical evolution in machine learning operations, moving beyond simple performance metrics to understand the why behind model predictions. This approach is essential for maintaining trust, ensuring compliance, and enabling proactive model management in production environments.
The foundation of explainable monitoring rests on several key concepts. Feature importance tracking allows teams to understand which variables most significantly influence model decisions over time. This is particularly valuable for detecting when the model’s decision-making logic shifts, potentially indicating concept drift or data quality issues. Local explanations provide insights into individual predictions, helping identify edge cases or problematic patterns, while global explanations reveal overall model behavior and decision boundaries.
Prediction confidence analysis is another crucial element, measuring how certain the model is about its predictions. Declining confidence scores often precede performance degradation, serving as an early warning system. Additionally, counterfactual explanations help understand what changes would alter a prediction, providing actionable insights for both model improvement and business decision-making.
The temporal aspect of explainability is particularly important in monitoring contexts. Explanation drift occurs when the reasoning behind predictions changes over time, even if overall performance remains stable. This can indicate subtle shifts in data patterns or model behavior that traditional metrics might miss.
For regulated industries, explainability in monitoring also addresses compliance and audit requirements. Financial services, healthcare, and other sectors need to demonstrate that their models make fair, unbiased decisions and can explain their reasoning to regulators and stakeholders.
Here’s a Python example demonstrating explainable model monitoring:
python

import pandas as pd

import numpy as np

import shap

from sklearn.ensemble import RandomForestClassifier

from sklearn.model_selection import train_test_split

import matplotlib.pyplot as plt

import warnings

warnings.filterwarnings('ignore')

class ExplainableModelMonitor:

    def __init__(self, model, feature_names):

        self.model = model

        self.feature_names = feature_names

        self.explainer = None

        self.baseline_importance = None

        self.historical_explanations = []

    def initialize_explainer(self, background_data):

        """Initialize SHAP explainer with background data"""

        self.explainer = shap.TreeExplainer(self.model)

        self.baseline_importance = self._calculate_feature_importance(background_data)

        print("✅ Explainer initialized with baseline feature importance")

    def _calculate_feature_importance(self, data):

        """Calculate SHAP feature importance"""

        shap_values = self.explainer.shap_values(data)

        if isinstance(shap_values, list):  # Multi-class case

            shap_values = shap_values[1]  # Use positive class

        importance = np.abs(shap_values).mean(axis=0)

        return dict(zip(self.feature_names, importance))

    def monitor_explanations(self, new_data, threshold=0.1):

        """Monitor for explanation drift and anomalies"""

        current_importance = self._calculate_feature_importance(new_data)

        # Calculate explanation drift

        drift_scores = {}

        for feature in self.feature_names:

            baseline_imp = self.baseline_importance.get(feature, 0)

            current_imp = current_importance.get(feature, 0)

            if baseline_imp > 0:

                drift_score = abs(current_imp - baseline_imp) / baseline_imp

                drift_scores[feature] = drift_score

                if drift_score > threshold:

                    print(f"⚠️  Explanation drift detected in {feature}: {drift_score:.3f}")

        # Store historical data

        self.historical_explanations.append({

            'timestamp': pd.Timestamp.now(),

            'importance': current_importance,

            'drift_scores': drift_scores

        })

        return drift_scores

    def analyze_prediction_confidence(self, data, predictions_proba):

        """Analyze prediction confidence and identify low-confidence cases"""

        confidence_scores = np.max(predictions_proba, axis=1)

        low_confidence_threshold = 0.6

        low_conf_indices = np.where(confidence_scores < low_confidence_threshold)[0]

        print(f"📊 Confidence Analysis:")

        print(f"   Mean confidence: {np.mean(confidence_scores):.3f}")

        print(f"   Low confidence predictions: {len(low_conf_indices)} ({len(low_conf_indices)/len(data)*100:.1f}%)")

        # Analyze low-confidence cases

        if len(low_conf_indices) > 0:

            low_conf_data = data.iloc[low_conf_indices]

            shap_values = self.explainer.shap_values(low_conf_data)

            if isinstance(shap_values, list):

                shap_values = shap_values[1]

            print(f"   Top features in low-confidence predictions:")

            feature_impact = np.abs(shap_values).mean(axis=0)

            top_features = np.argsort(feature_impact)[-3:][::-1]

            for i, feat_idx in enumerate(top_features):

                print(f"   {i+1}. {self.feature_names[feat_idx]}: {feature_impact[feat_idx]:.3f}")

        return confidence_scores, low_conf_indices

    def generate_explanation_report(self, data, sample_size=100):

        """Generate comprehensive explanation report"""

        sample_data = data.sample(min(sample_size, len(data)))

        shap_values = self.explainer.shap_values(sample_data)

        if isinstance(shap_values, list):

            shap_values = shap_values[1]

        # Feature importance plot

        plt.figure(figsize=(12, 6))

        plt.subplot(1, 2, 1)

        feature_importance = np.abs(shap_values).mean(axis=0)

        sorted_idx = np.argsort(feature_importance)

        plt.barh(range(len(sorted_idx)), feature_importance[sorted_idx])

        plt.yticks(range(len(sorted_idx)), [self.feature_names[i] for i in sorted_idx])

        plt.title('Current Feature Importance (SHAP)')

        plt.xlabel('Mean |SHAP Value|')

        # Explanation drift over time

        plt.subplot(1, 2, 2)

        if len(self.historical_explanations) > 1:

            timestamps = [exp['timestamp'] for exp in self.historical_explanations]

            # Plot drift for top 3 most important features

            top_features = sorted(self.baseline_importance.items(),

                                key=lambda x: x[1], reverse=True)[:3]

            for feature_name, _ in top_features:

                drift_values = [exp['drift_scores'].get(feature_name, 0)

                              for exp in self.historical_explanations]

                plt.plot(timestamps, drift_values, marker='o', label=feature_name)

            plt.title('Explanation Drift Over Time')

            plt.xlabel('Time')

            plt.ylabel('Drift Score')

            plt.legend()

            plt.xticks(rotation=45)

        plt.tight_layout()

        plt.show()

# Example usage

def demo_explainable_monitoring():

    # Generate sample data

    np.random.seed(42)

    n_samples = 1000

    X = pd.DataFrame({

        'feature_1': np.random.normal(0, 1, n_samples),

        'feature_2': np.random.normal(0, 1, n_samples),

        'feature_3': np.random.normal(0, 1, n_samples),

        'feature_4': np.random.normal(0, 1, n_samples)

    })

    y = (X['feature_1'] + X['feature_2'] * 0.5 + np.random.normal(0, 0.1, n_samples) > 0).astype(int)

    # Train model

    X_train, X_test, y_train, y_test = train_test_split(X, y, test_size=0.3, random_state=42)

    model = RandomForestClassifier(n_estimators=100, random_state=42)

    model.fit(X_train, y_train)

    # Initialize explainable monitor

    monitor = ExplainableModelMonitor(model, X.columns.tolist())

    monitor.initialize_explainer(X_train)

    # Simulate new data with drift

    X_new = X_test.copy()

    X_new['feature_1'] += 0.5  # Introduce drift

    # Monitor explanations

    drift_scores = monitor.monitor_explanations(X_new)

    # Analyze predictions

    predictions_proba = model.predict_proba(X_new)

    confidence_scores, low_conf_indices = monitor.analyze_prediction_confidence(X_new, predictions_proba)

    # Generate report

    monitor.generate_explanation_report(X_new)

    return monitor

# Run demo

# monitor = demo_explainable_monitoring()

# Created/Modified files during execution:

print("explainable_monitoring.py")
Tools and Frameworks for Explainable Monitoring
Explainable monitoring is becoming a standard in modern MLOps, as organizations seek not only to track model performance but also to understand and communicate the reasoning behind model predictions. The growing ecosystem of tools and frameworks makes it easier to integrate explainability into monitoring pipelines, whether you’re working with open-source solutions or enterprise platforms.
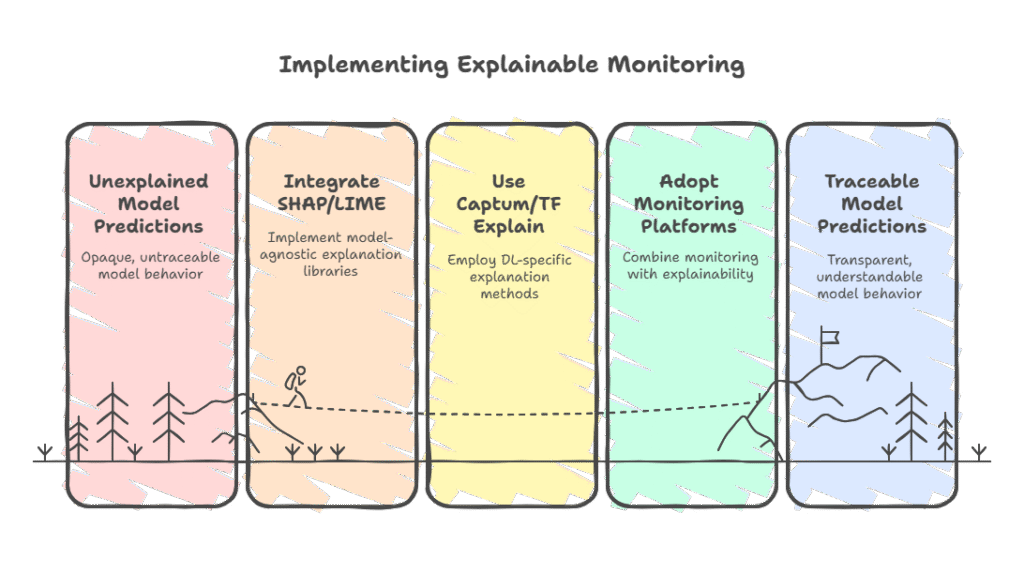
The most popular open-source libraries for explainability are SHAP (SHapley Additive exPlanations) and LIME (Local Interpretable Model-agnostic Explanations). SHAP provides both local and global explanations, quantifying the contribution of each feature to individual predictions and to the model as a whole. LIME, on the other hand, builds simple surrogate models around specific predictions to explain them in an interpretable way. Both tools are model-agnostic and can be integrated into monitoring workflows to generate explanations on demand or in batch.
For deep learning models, especially those built with PyTorch or TensorFlow, libraries like Captum (for PyTorch) and TF Explain (for TensorFlow) offer specialized explainability methods, including saliency maps and integrated gradients. These tools are particularly useful for computer vision and NLP applications, where understanding which parts of the input drive predictions is crucial.
On the monitoring side, platforms such as Fiddler, WhyLabs, and Arize AI provide end-to-end solutions that combine model monitoring with explainability. These platforms allow users to track feature drift, performance metrics, and feature importance over time, often with interactive dashboards. They also support alerting and root cause analysis, making it easier to respond to unexpected changes in model behavior.
For teams building custom solutions, libraries like ELI5 and Alibi offer additional explainability techniques, including permutation importance and counterfactual explanations. These can be integrated into existing monitoring pipelines to provide richer insights.
A typical explainable monitoring workflow might involve logging predictions and input features, running SHAP or LIME explanations on a sample of predictions, and visualizing feature importance trends over time. When combined with drift detection and performance monitoring, this approach enables teams to quickly identify not just when a model is failing, but also why.
Automated Retraining: When and How to Trigger
Automated retraining is a cornerstone of robust MLOps pipelines, ensuring that machine learning models remain accurate and relevant as data and business environments evolve. In production systems, models can degrade over time due to data drift, concept drift, or changes in user behavior. Automated retraining addresses this by systematically updating models without requiring constant manual intervention.
When to Trigger Retraining
The decision to trigger retraining should be based on clear, measurable signals. The most common triggers include:
Data drift: When the statistical properties of input data change significantly compared to the training data. This can be detected using statistical tests (e.g., Kolmogorov-Smirnov test) or monitoring feature distributions.
Concept drift: When the relationship between features and the target variable changes, often detected by a drop in model performance metrics such as accuracy, precision, or recall.
Scheduled intervals: In some cases, retraining is performed on a regular schedule (e.g., weekly or monthly), especially when data is known to change predictably over time.
Business events: Significant changes in business processes, regulations, or external factors may also warrant retraining.
How to Trigger Retraining
Automated retraining pipelines typically consist of several orchestrated steps:
Monitoring: Continuously track data distributions, model predictions, and performance metrics. Set thresholds for drift or performance degradation.
Alerting: When a threshold is breached, trigger an alert or automatically initiate the retraining process.
Data validation: Before retraining, validate the new data for quality, completeness, and consistency.
Retraining: Use the latest data to retrain the model. This can be done using orchestration tools like Apache Airflow, Kubeflow Pipelines, or cloud-native solutions.
Evaluation: Compare the new model’s performance against the current production model using a holdout set or cross-validation.
Deployment: If the new model outperforms the old one, deploy it to production. Otherwise, keep the existing model and investigate further.
Rollback and versioning: Maintain version control and the ability to roll back to a previous model if issues are detected post-deployment.
Example: Simple Automated Retraining Trigger in Python
Below is a minimal example of how you might trigger retraining based on a drop in model accuracy:
python

import numpy as np

from sklearn.metrics import accuracy_score

def should_trigger_retraining(current_accuracy, baseline_accuracy, threshold=0.05):

    """

    Decide whether to trigger retraining based on accuracy drop.

    """

    drop = baseline_accuracy - current_accuracy

    if drop > threshold:

        print(f"⚠️  Accuracy dropped by {drop:.3f}. Triggering retraining.")

        return True

    else:

        print(f"✅ Accuracy stable. No retraining needed.")

        return False

# Example usage

baseline_accuracy = 0.92

current_accuracy = 0.85

should_trigger_retraining(current_accuracy, baseline_accuracy)
Automated retraining, when implemented thoughtfully, helps maintain model performance, reduces manual workload, and ensures that machine learning systems adapt to real-world changes. The key is to combine robust monitoring with clear retraining criteria and reliable orchestration, so that models stay fresh and effective without constant human oversight.
Building a Robust Monitoring and Retraining Pipeline
A robust monitoring and retraining pipeline is the backbone of any production-grade machine learning system. Its main goal is to ensure that models remain accurate, reliable, and aligned with business objectives, even as data and real-world conditions change. Such a pipeline automates the detection of issues, triggers retraining when necessary, and manages the safe deployment of updated models.
Key Components of the Pipeline
The pipeline typically starts with continuous data and prediction logging. Every input, prediction, and outcome (if available) is stored for later analysis. This historical data is crucial for monitoring, debugging, and retraining.
Next, the system performs real-time or batch monitoring of both data and model performance. This includes tracking feature distributions (to detect data drift), monitoring key metrics like accuracy or F1-score (to catch performance drops), and using explainability tools to understand changes in model behavior. Automated alerts are configured to notify the team or trigger downstream actions when thresholds are breached.
When an issue is detected—such as significant drift or a drop in performance—the pipeline can automatically initiate retraining. This process involves validating the new data, retraining the model, and rigorously evaluating its performance. Only if the new model outperforms the current one (on a holdout or validation set) does the pipeline proceed to deployment.
Deployment and Rollback
Deployment should be handled with care. Techniques like canary releases or A/B testing can be used to minimize risk, gradually rolling out the new model and monitoring its real-world performance. If problems arise, the pipeline must support easy rollback to a previous, stable model version.
Automation and Orchestration
Automation is key to reliability and scalability. Tools like Apache Airflow, Kubeflow Pipelines, or cloud-native orchestrators (e.g., AWS Step Functions, Google Cloud Composer) are commonly used to manage the workflow, schedule tasks, and handle dependencies. Version control for both data and models ensures reproducibility and traceability.
Best Practices
A robust pipeline should include comprehensive validation steps (to catch data quality issues), logging and monitoring at every stage, and clear alerting mechanisms. It’s also important to document the pipeline’s logic and maintain transparency for audits and compliance.
Example: High-Level Pipeline Flow
Log incoming data and predictions.
Monitor for data drift and performance degradation.
Trigger retraining if thresholds are exceeded.
Validate and retrain the model using the latest data.
Evaluate the new model against the current one.
Deploy the new model if it performs better; otherwise, keep the existing model.
Roll back if post-deployment monitoring detects issues.
Best Practices for Explainable Monitoring in Production
Explainable monitoring in production is about more than just tracking metrics—it’s about ensuring that machine learning models remain transparent, trustworthy, and actionable as they operate in real-world environments. Implementing best practices in this area helps organizations catch issues early, maintain compliance, and build confidence among both technical and non-technical stakeholders.
1. Integrate Explainability from the Start
Don’t treat explainability as an afterthought. Choose models and frameworks that support interpretability, and design your monitoring pipeline to capture not only predictions and performance metrics but also explanations for those predictions. This makes it easier to debug, audit, and communicate model behavior later on.
2. Monitor Both Global and Local Explanations
Track global feature importance to understand which variables drive your model overall, and monitor how these importances change over time. At the same time, sample local explanations for individual predictions—especially for edge cases or outliers—to catch unexpected behaviors or biases that might not show up in aggregate metrics.
3. Automate Drift and Explanation Checks
Set up automated checks for data drift, concept drift, and explanation drift. If the features influencing predictions start to change, or if the model’s reasoning shifts, trigger alerts or retraining. This proactive approach helps prevent silent model degradation.
4. Visualize and Communicate Explanations
Use dashboards and visualization tools to make explanations accessible to different audiences. Visual summaries of feature importance, drift over time, and local explanations can help business users, data scientists, and compliance teams quickly understand what’s happening and why.
5. Log Explanations for Auditing and Compliance
Store explanations alongside predictions and input data. This historical record is invaluable for audits, regulatory reviews, and post-hoc analysis if something goes wrong. It also supports reproducibility and transparency.
6. Test Explainability in CI/CD Pipelines
Include explainability checks in your automated testing and deployment pipelines. For example, compare feature importance distributions between model versions to ensure that changes are expected and justified.
7. Balance Performance and Interpretability
While complex models may offer higher accuracy, they can be harder to explain. Strive for a balance that meets your business and regulatory needs. Sometimes, a slightly less accurate but more interpretable model is the better choice for production.
8. Educate Stakeholders
Train your team and stakeholders on how to interpret and use explanations. The value of explainable monitoring is only realized if people understand and trust the insights it provides.
From Jupyter Notebook to the Cloud: MLOps Step by Step
Monitoring ML models in production: tools, challenges, and best practices
MLOps in the Era of Generative Artificial Intelligence: New Challenges and Opportunities