

Introduction
The Limits of Traditional CI/CD for ML Systems
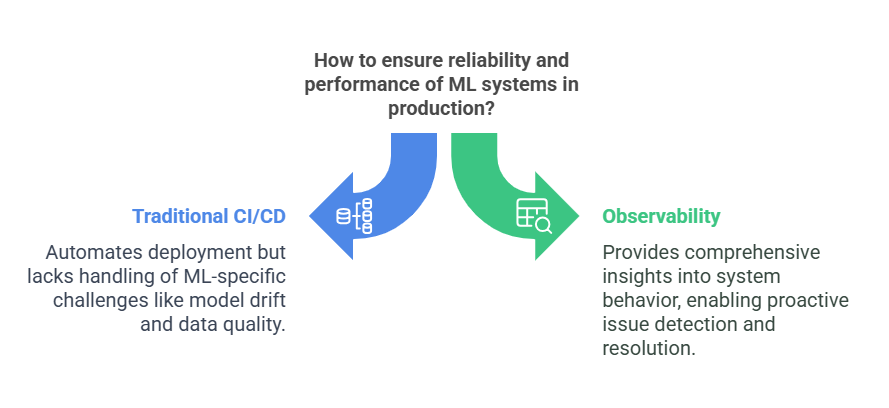
Continuous Integration and Continuous Deployment (CI/CD) pipelines have revolutionized software development by automating the build, test, and deployment processes. However, when it comes to machine learning (ML) systems, traditional CI/CD approaches face significant limitations. Unlike conventional software, ML models are data-driven and evolve over time as new data becomes available. This dynamic nature introduces complexities such as model drift, data quality issues, and unpredictable inference behavior that traditional CI/CD pipelines are not designed to handle.
Moreover, ML systems often involve multiple components beyond code, including data preprocessing, feature engineering, model training, and serving infrastructure. Each of these components requires monitoring and validation to ensure the system performs reliably in production. Therefore, relying solely on CI/CD for deployment without comprehensive observability can lead to undetected failures, degraded model performance, and ultimately, business risks.
Why Observability ≠ Monitoring
Observability and monitoring are related but distinct concepts. Monitoring typically involves tracking predefined metrics and alerting when thresholds are breached. While monitoring is essential, it provides a limited view focused on known issues. Observability, on the other hand, is a broader discipline that enables understanding of system behavior by collecting and correlating diverse telemetry data such as metrics, logs, and traces.
In ML systems, observability is crucial because it allows teams to diagnose complex issues like data drift, feature skew, or latency spikes that may not trigger traditional alerts. Observability empowers engineers to ask new questions about the system’s internal state and gain insights that are not possible through monitoring alone. This proactive approach is vital for maintaining the health and reliability of production ML systems.
Key Challenges in ML Observability
ML observability faces unique challenges compared to traditional software systems. Some of the key challenges include:
- Model Decay: Over time, models may become less accurate as the underlying data distribution changes, requiring continuous tracking of model performance metrics.
- Data Drift: Changes in input data characteristics can lead to degraded model predictions, necessitating real-time detection of feature distribution shifts.
- Latency Spikes: ML inference latency can vary due to resource contention or model complexity, impacting user experience and system throughput.
- High Cardinality and Dimensionality: ML systems often deal with large numbers of features and complex data structures, making telemetry collection and analysis more challenging.
Addressing these challenges requires advanced observability patterns tailored specifically for ML workloads.
Foundations of ML Observability
The Three Pillars: Metrics, Logs, and Traces
Effective observability relies on three core data types:
- Metrics: Quantitative measurements collected over time, such as model inference latency, error rates, or feature distribution statistics. Metrics provide a high-level overview of system health and performance trends.
- Logs: Detailed, timestamped records of events and system activities. Logs capture granular information useful for debugging and understanding the context of anomalies.
- Traces: Distributed traces track the flow of requests through various components of an ML pipeline, enabling root cause analysis of latency issues or failures.
Combining these pillars allows teams to build a comprehensive picture of ML system behavior, facilitating faster diagnosis and resolution of issues.
ML-Specific Signals
Beyond traditional observability data, ML systems require specialized signals to monitor model health and data quality:
- Feature Drift: Monitoring changes in the statistical distribution of input features compared to training data.
- Prediction Skew: Detecting discrepancies between model predictions in production and expected outcomes.
- Concept Shift: Identifying changes in the relationship between input features and target variables that affect model accuracy.
Capturing and analyzing these signals in real time is essential for maintaining model reliability and trustworthiness.
OpenTelemetry vs. Prometheus: Complementary Roles
OpenTelemetry and Prometheus are two leading open-source tools that play complementary roles in ML observability:
- OpenTelemetry: Provides a unified framework for collecting metrics, logs, and traces across distributed systems. Its vendor-neutral design and rich SDKs enable instrumentation of complex ML workflows, including data ingestion, model training, and serving.
- Prometheus: Specializes in time-series metrics collection and alerting. It excels at scraping and storing high-resolution metrics, making it ideal for monitoring model performance indicators and system resource usage.
Together, these tools form a robust observability stack that addresses the diverse telemetry needs of production ML systems.
Instrumenting ML Systems with OpenTelemetry
Auto-Instrumentation for ML Pipelines
Modern ML systems require deep visibility across the entire workflow, from data ingestion to model serving. OpenTelemetry’s auto-instrumentation capabilities for Python and Go applications dramatically simplify this process. For Python-based ML pipelines, the opentelemetry-instrumentation suite automatically captures:
- Execution times for data preprocessing functions
- Memory usage during feature transformation
- Model loading and initialization metrics
The instrumentation works by wrapping common ML frameworks like scikit-learn, TensorFlow, and PyTorch, requiring minimal code changes. A simple decorator can instrument custom training loops:
python

from opentelemetry.instrumentation.fastapi import FastAPIInstrumentor

from opentelemetry.instrumentation.requests import RequestsInstrumentor

# Auto-instrument a FastAPI model server

FastAPIInstrumentor().instrument()

RequestsInstrumentor().instrument()
Custom Metrics for Model Performance
While auto-instrumentation covers basic telemetry, production ML systems need domain-specific metrics. OpenTelemetry’s metrics API supports creating custom instruments that track:
Model Quality Metrics
- Prediction confidence distributions
- Class imbalance in outputs
- Business-specific KPIs (e.g., fraud detection precision)
System Performance Metrics
- Batch processing throughput
- GPU utilization during inference
- Feature store lookup latency
Example of defining a custom metric for drift detection:
python

from opentelemetry import metrics

meter = metrics.get_meter("ml_monitoring")

drift_gauge = meter.create_observable_gauge(

    name="feature_drift_score",

    callbacks=[get_current_drift_values],

    unit="1",

    description="Tracks distribution shift in input features"

)
Distributed Tracing for End-to-End Workflows
Complex ML pipelines spanning multiple services require distributed tracing to identify bottlenecks. OpenTelemetry’s trace context propagation ensures visibility across:
- Data validation microservices
- Feature engineering jobs
- Model serving endpoints
- Business logic layers
A well-instrumented trace will show:
- Time spent in each processing stage
- Error propagation paths
- Cold start delays in serverless components
python

from opentelemetry import trace

tracer = trace.get_tracer("pipeline_tracer")

with tracer.start_as_current_span("predict") as span:

    span.set_attributes({

        "model.version": "v3.2",

        "input.features_count": 42,

        "user.tier": "premium"

    })

    # Prediction logic here
Prometheus for ML-Specific Monitoring
Metric Design for ML Models
Effective Prometheus metric design follows these principles for ML systems:
Dimensionality Control
- Limit high-cardinality labels (avoid user_id as label)
- Use histograms for latency metrics
- Separate operational vs business metrics
Lifecycle Tracking
- Model versions as labels (not separate metrics)
- Deployment stage (canary/prod) as label
- Data source identifiers
Example metric definition:
# HELP model_inference_latency_seconds Inference request duration
# TYPE model_inference_latency_seconds histogram
model_inference_latency_seconds_bucket{model=”fraud_detection”,version=”v2.1″,le=”0.1″} 42
model_inference_latency_seconds_sum{model=”fraud_detection”,version=”v2.1″} 3.21
model_inference_latency_seconds_count{model=”fraud_detection”,version=”v2.1″} 100
Alerting Rules for Anomalies
Production-grade alerting requires multi-stage conditions:
yaml

- alert: FeatureDriftDetected

  expr: abs(feature_drift_score{feature="transaction_amount"}) > 0.3

  for: 30m

  labels:

    severity: warning

  annotations:

    summary: "Drift detected in transaction amounts"
Data Quality Alerts
Performance Degradation
yaml

- alert: ModelLatencySpike

  expr:

    rate(model_inference_latency_seconds_sum[5m])

    / rate(model_inference_latency_seconds_count[5m]) > 0.5

  for: 10m

Concept Drift Detection

yaml

Copy Code

- alert: PredictionDistributionChanged

  expr:

    abs(

      avg_over_time(prediction_histogram[1h])

      - avg_over_time(prediction_histogram[1h] offset 1d)

    ) > 0.2
Long-Term Storage with Thanos/Cortex
For ML systems requiring months of metric retention:
Thanos Architecture
- Global query view across Prometheus instances
- Object storage (S3/GCS) integration
- Downsampling for cost efficiency
Cortex Features
- Horizontal scaling for high cardinality
- Multi-tenancy support
- Streaming aggregation
Configuration snippet for Thanos sidecar:
yaml

type: S3

config:

  bucket: ml-metrics-archive

  endpoint: s3.eu-central-1.amazonaws.com

  signature_version2: false
Advanced Observability Patterns for Production ML Systems
Dynamic Baseline Adaptation
Modern ML systems require self-adjusting monitoring thresholds that evolve with data distributions. Key implementation strategies include:
Rolling Statistical Baselines
python

# Calculate 7-day moving percentiles

baseline = df['prediction_score'].rolling(window='7d').quantile(0.95)
Seasonal Pattern Recognition
python

from statsmodels.tsa.seasonal import STL

stl = STL(metrics_series, period=24*7)

res = stl.fit()

seasonal_adjusted = res.trend + res.resid
Concept Drift Detection
python

from alibi_detect import KSDrift

drift_detector = KSDrift(

    x_ref=training_features,

    p_val=0.05,

    window_size=1000

)

preds = drift_detector.predict(production_features)
Cross-Signal Correlation Analysis
Uncovering hidden relationships between technical and business metrics:
- Latency-Accuracy Tradeoff Monitoring
promql

# PromQL query correlating P99 latency with accuracy drops

(1 - (model_accuracy / model_accuracy offset 1h))

/ (model_inference_latency_seconds{p99="true"} > 0.5)
Resource Utilization Impact
python

# GPU memory pressure vs prediction errors

sns.jointplot(

    x='gpu_mem_util',

    y='prediction_errors',

    data=monitoring_df,

    kind='reg'

)
Business Metric Alignment
sql
Copy SQL
— BigQuery ML for metric correlations
CREATE MODEL `project.metric_correlations`
OPTIONS(MODEL_TYPE=’LINEAR_REG’) AS
SELECT
inference_latency,
conversion_rate,
bounce_rate
FROM production_metrics
Case Study: Video Recommendation System at Scale
Architecture Deep Dive
The production system implements a multi-layered approach:
Real-Time Feature Pipeline
- Frame sampling at 1fps using FFmpeg
- On-the-fly content analysis with TensorRT-optimized models
- Dynamic feature enrichment from user history
Hierarchical Model Serving
mermaid
graph TD
A[Raw Video] –> B[Content Analysis]
B –> C[Candidate Generation]
C –> D[Fine Ranking]
D –> E[Diversity Filter]
E –> F[Final Recommendations]
Fallback Mechanisms
- Content-based similarity fallback
- Trending videos cache
- Bandit algorithms for cold-start items
Critical Observability Insights
Key lessons from operating at 10M+ RPS:
Essential Metrics
- Engagement Surface Area: Measures recommendation diversity
- Watch Time Lift: Compared to non-personalized baseline
- Serving Health Index: Composite score of latency/errors
Anomaly Detection
python

# Isolation Forest for multivariate anomaly detection

from sklearn.ensemble import IsolationForest

clf = IsolationForest(n_estimators=100)

anomalies = clf.fit_predict(feature_matrix)
Performance Optimization
- Achieved 40% latency reduction through:
- Frame sampling optimization
- Model quantization
- Request coalescing
- Reduced 95th percentile latency from 320ms to 190ms
Operational Challenges
- Managing GPU memory fragmentation
- A/B test traffic routing
- Regional cache invalidation
Seamless Integration with Enterprise MLOps Ecosystems
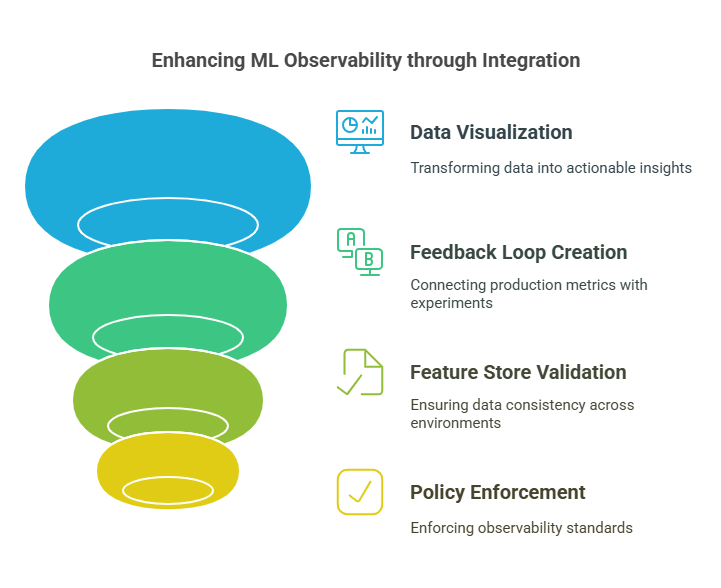
The true power of advanced observability emerges when seamlessly integrated with existing MLOps toolchains. Modern machine learning platforms require bidirectional connectivity between monitoring systems and the broader ML infrastructure. Grafana serves as the visualization nerve center, transforming raw telemetry from OpenTelemetry and Prometheus into actionable insights through customizable dashboards that track everything from GPU memory pressure to prediction latency percentiles. These dashboards don’t just display static metrics – they enable drill-down analysis from business-level KPIs to granular system performance indicators through carefully designed query variables and annotation layers.
Deep integration with MLflow bridges the critical gap between experimentation and production. The platform’s REST API allows automated logging of production metrics back to original experiment runs, creating closed-loop feedback that connects offline evaluation with real-world performance. Model registry events trigger automatic configuration of observability pipelines – when a new champion model gets promoted, the monitoring system dynamically adjusts its baseline comparisons and alert thresholds without manual intervention. This tight coupling ensures observability configurations stay synchronized with model versions.
Feature stores demand special consideration in this integrated architecture. As the source of truth for serving features, they require continuous validation against monitoring data. Automated reconciliation jobs compare feature distributions between training and serving environments, while real-time feature logging captures actual values used in production predictions. The observability system maintains temporal alignment between feature store updates and model outputs through precise event timestamping and watermark propagation across distributed systems.
The most sophisticated implementations incorporate policy-as-code frameworks like Open Policy Agent to enforce organizational standards. These systems automatically validate that all models in production meet predefined observability requirements before deployment – ensuring proper metric instrumentation, alert rule configuration, and retention policy setup. Compliance reports generate on-demand, proving adherence to internal governance rules and external regulations through cryptographically verifiable evidence chains.
Future Trends in ML Observability and Monitoring
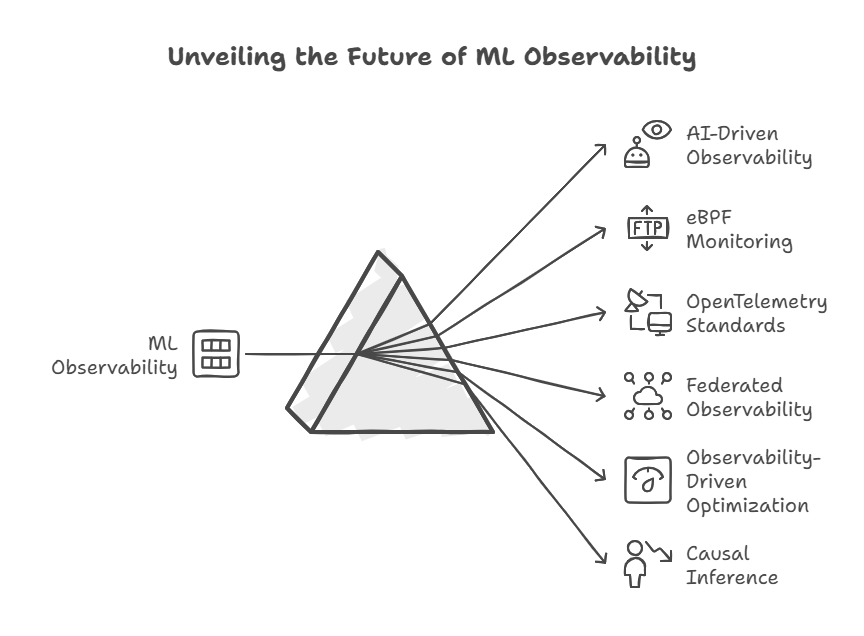
The rapid evolution of machine learning systems is driving transformative changes in how we monitor and maintain production models. Emerging technologies are pushing observability beyond traditional metrics and dashboards into more intelligent, adaptive paradigms. One of the most significant shifts is the rise of AI-driven observability, where machine learning itself is being used to monitor machine learning systems. Techniques like anomaly detection clustering and predictive failure analysis enable platforms to surface issues before they impact performance, moving from reactive alerting to proactive system health management.
eBPF (extended Berkeley Packet Filter) is revolutionizing kernel-level monitoring for ML workloads. By providing deep visibility into low-level system interactions without requiring code instrumentation, eBPF allows teams to track GPU memory access patterns, inter-process communication bottlenecks, and filesystem operations that traditional monitoring tools miss. This is particularly valuable for debugging performance issues in custom ML operators and framework extensions.
The growing adoption of OpenTelemetry’s ML-specific semantic conventions is creating new standards for how we instrument models. These conventions provide consistent naming and tagging for ML-specific metrics like feature drift scores, embedding space distances, and concept shift indicators. As the ecosystem matures, we’re seeing the emergence of auto-instrumentation capabilities for popular frameworks that capture training dynamics, inference characteristics, and data pipeline behaviors out of the box.
Federated observability is becoming crucial as organizations deploy models across hybrid architectures. Techniques for securely aggregating monitoring data from edge devices, on-premise clusters, and multiple cloud providers while preserving privacy are gaining traction. This includes differential privacy approaches for metrics collection and secure multi-party computation for aggregating performance indicators across organizational boundaries.
Perhaps most transformative is the concept of observability-driven optimization, where monitoring data actively guides system reconfiguration. We’re seeing early examples of systems that automatically adjust model serving parameters, feature encoding schemes, and even architectural choices based on observed performance patterns. This creates a continuous improvement loop where the monitoring system doesn’t just identify issues but participates in their resolution.
The frontier of ML observability is also being reshaped by causal inference techniques that move beyond correlation to understand the root causes of model degradation. By combining observational data with controlled experiments, these methods can distinguish between data drift, concept drift, and infrastructure-induced anomalies. This represents a fundamental shift from simply detecting problems to truly understanding their origins in complex, interconnected ML systems.
The Future of Production ML: Towards Autonomous Model Operations
As machine learning systems grow increasingly complex and business-critical, the next frontier lies in autonomous model operations—self-regulating ML deployments that require minimal human intervention. This evolution is being driven by several transformative trends that are reshaping how we build, deploy, and maintain production ML systems.
Self-Optimizing Model Pipelines
The next generation of ML infrastructure will feature closed-loop optimization, where models continuously adapt their behavior based on real-time performance feedback. Reinforcement learning is emerging as a powerful tool for this, with systems that automatically:
- Adjust inference parameters (batch sizes, precision levels)
- Tune feature preprocessing steps
- Switch between model variants based on context
These systems go beyond static A/B testing frameworks, employing multi-armed bandit and contextual bandit approaches to dynamically balance exploration and exploitation in production.
Predictive Maintenance for ML Systems
Drawing inspiration from industrial IoT, we’re seeing the development of ML health forecasting systems that:
- Predict model decay timelines using survival analysis
- Anticipate feature drift before it impacts performance
- Schedule proactive retraining based on data freshness metrics
These capabilities transform model maintenance from reactive firefighting to strategic, calendarized operations.
Federated Learning Operations (FLOps)
As federated learning moves from research to production, new operational paradigms are emerging:
- Cross-silo model diagnostics that respect data privacy
- Secure aggregation of performance metrics
- Differential privacy compliant monitoring
This enables organizations to maintain observability across decentralized training environments while preserving data confidentiality.
The Rise of ML-Specific SRE
Machine learning is creating new specializations within Site Reliability Engineering:
- Model SLOs that go beyond uptime to include prediction quality
- ML canary deployments with automated rollback triggers
- Capacity planning for unpredictable inference patterns
These practices are being codified into ML reliability engineering frameworks that blend traditional SRE principles with ML-specific considerations.
Ethical AI Operations
Future tooling will bake ethical considerations into operational workflows:
- Automated bias detection in production predictions
- Fairness-aware auto-scaling decisions
- Explainability preservation across model versions
Conclusion: Building Future-Proof MLOps Observability
The journey through advanced ML observability reveals a fundamental truth: modern machine learning systems require monitoring paradigms as sophisticated as the models themselves. We’ve moved far beyond simple accuracy metrics into a world where comprehensive system understanding demands interconnected telemetry, intelligent alerting, and proactive adaptation.
Several key principles emerge as critical for teams building production ML systems:
Observability as a First-Class Citizen
Treat monitoring instrumentation with the same rigor as model architecture. Just as we carefully design neural network layers, we must deliberately construct our observation layers – ensuring every critical interaction generates the right signals at the right granularity.
The Feedback Loop Imperative
Effective observability creates virtuous cycles where production insights directly improve model development. This requires breaking down silos between data scientists, ML engineers, and platform teams through shared metrics and dashboards that speak to each role’s concerns.
Adaptive Intelligence
Static thresholds and rules inevitably fail in dynamic ML environments. The most robust systems employ meta-monitoring – using ML techniques to watch the watchers, automatically adjusting sensitivity and focus as systems evolve.
The Full-Stack Perspective
True understanding comes from correlating metrics across the entire stack – from GPU kernel timings to business KPIs. This vertical visibility transforms isolated data points into actionable narratives about system behavior.
As we look ahead, the boundary between observability and active system management continues to blur. The next generation of tools won’t just inform human decisions but will directly orchestrate model behavior – adjusting, scaling, and even self-healing based on real-time understanding of system state.
Monitoring Models in Production – Tools and Strategies for 2025
The best MLOps tools of 2025 – comparison and recommendations