

Introduction: Bridging the Gap Between Development and Production
Machine learning has moved beyond the research lab and is now a core part of many business applications. However, taking a model from code to production is a complex journey that involves more than just building an accurate algorithm. Developers face unique challenges in deploying, managing, and maintaining machine learning models at scale. This is where MLOps tools come into play, providing the frameworks and automation needed to bridge the gap between development and production environments.
1.1 The Challenges of Deploying Machine Learning Models
Deploying machine learning models is fundamentally different from deploying traditional software. Some of the key challenges include:
Data Dependency: ML models are highly dependent on the quality and consistency of data. Any change in data can impact model performance, making data versioning and validation critical.
Experiment Management: Developers often run hundreds of experiments with different parameters, data splits, and algorithms. Tracking these experiments and reproducing results can be difficult without the right tools.
Model Versioning: Unlike code, models are artifacts generated from data and code. Managing different versions of models, tracking their lineage, and rolling back to previous versions requires specialized tools.
Deployment Complexity: Models need to be deployed in environments that may differ from development setups. Ensuring consistency, scalability, and reliability in production is a major challenge.
Monitoring and Maintenance: Once deployed, models must be monitored for performance, data drift, and anomalies. Continuous retraining and updating are often necessary to maintain accuracy.
These challenges highlight the need for robust MLOps practices and tools that can automate, standardize, and streamline the entire machine learning lifecycle.
1.2 Why MLOps Tools Matter for Developers
MLOps tools are designed to address the unique challenges of machine learning in production. For developers, these tools offer several key benefits:
Automation: MLOps tools automate repetitive tasks such as data preprocessing, model training, deployment, and monitoring. This reduces manual errors and accelerates the development cycle.
Reproducibility: By tracking experiments, data, and model versions, MLOps tools ensure that results can be reliably reproduced and audited.
Collaboration: Many MLOps platforms support team collaboration, enabling developers, data scientists, and operations teams to work together seamlessly.
Scalability: With orchestration and infrastructure management features, MLOps tools make it easier to scale ML workflows from a single model to hundreds of models in production.
Monitoring and Governance: Built-in monitoring, alerting, and compliance features help developers maintain model performance and meet regulatory requirements.
Example: The Role of MLOps Tools in a Typical Workflow
Below is a simplified Python example that demonstrates how MLOps tools can be integrated into a typical machine learning workflow, from experiment tracking to model deployment:
python
Copy Code
import mlflow
import pandas as pd
from sklearn.ensemble import RandomForestClassifier
from sklearn.model_selection import train_test_split
import joblib
# Load and split data
df = pd.read_csv(„data/train.csv”)
X = df.drop(„target”, axis=1)
y = df[„target”]
X_train, X_test, y_train, y_test = train_test_split(X, y, test_size=0.2)
# Track experiment with MLflow
mlflow.set_experiment(„Production_ML_Workflow”)
with mlflow.start_run():
model = RandomForestClassifier()
model.fit(X_train, y_train)
accuracy = model.score(X_test, y_test)
mlflow.log_metric(„accuracy”, accuracy)
mlflow.sklearn.log_model(model, „model”)
joblib.dump(model, „models/model.pkl”)
print(f”Model trained and logged with accuracy: {accuracy:.2f}”)
In this example, MLflow is used to track the experiment, log metrics, and save the model artifact. This is just one illustration of how MLOps tools can streamline the path from code to production.
Experiment Tracking and Model Management
Experiment tracking and model management are foundational components of a robust MLOps workflow. As machine learning projects grow in complexity, developers need tools that help them organize, compare, and reproduce experiments, as well as manage the lifecycle of models from training to deployment. In this section, we’ll explore three leading tools—MLflow, Weights & Biases, and Neptune.ai—that empower developers to streamline experiment tracking and model management.
2.1 MLflow: Managing the ML Lifecycle
MLflow is an open-source platform designed to manage the complete machine learning lifecycle, including experiment tracking, model packaging, and deployment. It is language-agnostic and integrates seamlessly with popular ML libraries such as scikit-learn, TensorFlow, and PyTorch.
Key Features:
Experiment Tracking: Log parameters, metrics, artifacts, and code versions for each run.
Model Registry: Store, annotate, and manage model versions in a central repository.
Reproducibility: Track the exact data, code, and environment used for each experiment.
Deployment: Package models for deployment to various platforms, including REST APIs and cloud services.
Example: Tracking an Experiment with MLflow
python
Copy Code
import mlflow
import mlflow.sklearn
from sklearn.ensemble import RandomForestClassifier
from sklearn.datasets import load_iris
from sklearn.model_selection import train_test_split
# Load data
iris = load_iris()
X_train, X_test, y_train, y_test = train_test_split(iris.data, iris.target, random_state=42)
# Start MLflow experiment
mlflow.set_experiment(„Iris_Classification”)
with mlflow.start_run():
model = RandomForestClassifier(n_estimators=100)
model.fit(X_train, y_train)
accuracy = model.score(X_test, y_test)
mlflow.log_param(„n_estimators”, 100)
mlflow.log_metric(„accuracy”, accuracy)
mlflow.sklearn.log_model(model, „model”)
print(f”Logged model with accuracy: {accuracy:.2f}”)
MLflow’s flexibility and ease of use make it a popular choice for both individual developers and large teams.
2.2 Weights & Biases: Collaborative Experiment Tracking
Weights & Biases (W&B) is a cloud-based platform that focuses on collaborative experiment tracking, visualization, and reporting. It is widely used in research and industry for its intuitive interface and powerful integrations.
Key Features:
Real-Time Experiment Tracking: Log and visualize metrics, hyperparameters, and outputs in real time.
Collaboration: Share dashboards and reports with team members for transparent, collaborative development.
Artifact Management: Track datasets, models, and other artifacts across experiments.
Integrations: Works with popular ML frameworks and cloud platforms.
Example: Logging Experiments with Weights & Biases
python
Copy Code
import wandb
import pandas as pd
from sklearn.ensemble import RandomForestClassifier
from sklearn.model_selection import train_test_split
# Initialize W&B project
wandb.init(project=”mlops-demo”)
# Load data
df = pd.read_csv(„data/train.csv”)
X = df.drop(„target”, axis=1)
y = df[„target”]
X_train, X_test, y_train, y_test = train_test_split(X, y, test_size=0.2)
# Train and log
model = RandomForestClassifier(n_estimators=100)
model.fit(X_train, y_train)
accuracy = model.score(X_test, y_test)
wandb.log({„accuracy”: accuracy, „n_estimators”: 100})
W&B’s collaborative features make it ideal for teams working on shared projects and large-scale experiments.
2.3 Neptune.ai: Centralized Experiment Management
Neptune.ai is a metadata store for MLOps, specializing in experiment tracking, model registry, and monitoring. It is designed for teams that need a centralized, scalable solution for managing ML metadata.
Key Features:
Centralized Tracking: Store and organize all experiment metadata in one place.
Custom Metadata: Log custom parameters, metrics, images, and interactive visualizations.
Model Registry: Manage model versions, stages, and deployment status.
Integrations: Compatible with Python, R, and major ML frameworks.
Example: Using Neptune.ai for Experiment Tracking
python
Copy Code
import neptune.new as neptune
import pandas as pd
from sklearn.ensemble import RandomForestClassifier
from sklearn.model_selection import train_test_split
# Initialize Neptune run
run = neptune.init(project=”your_workspace/mlops-demo”, api_token=”YOUR_API_TOKEN”)
# Load data
df = pd.read_csv(„data/train.csv”)
X = df.drop(„target”, axis=1)
y = df[„target”]
X_train, X_test, y_train, y_test = train_test_split(X, y, test_size=0.2)
# Train and log
model = RandomForestClassifier(n_estimators=100)
model.fit(X_train, y_train)
accuracy = model.score(X_test, y_test)
run[„parameters/n_estimators”] = 100
run[„metrics/accuracy”] = accuracy
run.stop()
Neptune.ai’s robust tracking and model management capabilities make it a strong choice for organizations with complex ML workflows.
Data Versioning and Management
Data is the foundation of every machine learning project, and its quality, consistency, and traceability are critical for building reliable models. As datasets grow in size and complexity, managing data versions and ensuring data lineage become essential tasks for developers. MLOps tools for data versioning and management help teams track changes, reproduce experiments, and maintain compliance. In this section, we’ll explore three leading tools: DVC, LakeFS, and Pachyderm.
3.1 DVC (Data Version Control): Versioning Large Datasets
DVC (Data Version Control) is an open-source tool that brings Git-like version control to data and machine learning models. It enables teams to track, share, and manage large datasets and model files alongside code, making experiments reproducible and collaborative.
Key Features:
Data Versioning: Track changes to datasets and model artifacts, just like you do with code in Git.
Pipeline Management: Define and automate data processing and ML pipelines.
Remote Storage: Store large files in cloud storage (S3, GCS, Azure) while keeping lightweight pointers in your Git repository.
Collaboration: Share data and models across teams without duplicating files.
Example: Versioning Data with DVC
bash
Copy Code
# Initialize DVC in your project
dvc init
# Add a dataset to DVC tracking
dvc add data/train.csv
# Commit DVC files to Git
git add data/train.csv.dvc .gitignore
git commit -m „Track training data with DVC”
With DVC, you can easily roll back to previous versions of your data and ensure that every experiment is reproducible.
3.2 LakeFS: Git-like Data Versioning for Data Lakes
LakeFS is an open-source platform that brings Git-like operations to data lakes. It allows teams to create branches, commit changes, and manage data versions at scale, making it ideal for organizations working with large, distributed datasets.
Key Features:
Branching and Merging: Create isolated branches for experiments, merge changes, and roll back if needed.
Atomic Commits: Ensure data consistency across large datasets with atomic commit operations.
Integration: Works with popular data lake storage solutions like AWS S3 and Azure Blob Storage.
Data Lineage: Track the history and provenance of data changes.
Example: Branching Data in LakeFS (Python SDK)
python
Copy Code
import lakefs_client
from lakefs_client.client import LakeFSClient
client = LakeFSClient(host=”https://lakefs.example.com”, access_key=”YOUR_KEY”, secret_key=”YOUR_SECRET”)
# Create a new branch for an experiment
client.branches.create_branch(repository=”my-data-repo”, branch_creation={„name”: „experiment-branch”, „source”: „main”})
print(„Branch created for experiment.”)
LakeFS enables safe experimentation and collaboration on large-scale data without risking production data integrity.
3.3 Pachyderm: Data Lineage and Pipeline Management
Pachyderm is an open-source data versioning and pipeline orchestration platform designed for scalable, reproducible data science. It combines data versioning with containerized pipelines, making it easy to track data lineage and automate complex workflows.
Key Features:
Data Provenance: Automatically track the lineage of every data transformation and model output.
Pipeline Automation: Define data processing pipelines as code using Docker containers.
Scalability: Built on Kubernetes for distributed, scalable processing.
Reproducibility: Every result can be traced back to the exact data and code used.
Example: Defining a Pachyderm Pipeline (YAML)
yaml
Copy Code
pipeline:
name: preprocess-data
transform:
image: python:3.9
cmd: [ „python3”, „/pfs/in/raw/process.py” ]
input:
pfs:
repo: raw
glob: „/*”
This pipeline automatically processes new data added to the raw repository, ensuring every step is versioned and reproducible.
Model Deployment and Serving
Deploying machine learning models is a crucial step in transforming prototypes into real-world applications. The right deployment and serving tools ensure that models are accessible, scalable, and reliable in production environments. For developers, choosing the right tool depends on the framework, infrastructure, and performance requirements. In this section, we’ll explore three leading tools for model deployment and serving: TensorFlow Serving, TorchServe, and Seldon Core.
4.1 TensorFlow Serving: High-Performance Model Serving
TensorFlow Serving is an open-source serving system specifically designed for deploying TensorFlow models in production. It provides a flexible, high-performance solution for serving models via gRPC or REST APIs.
Key Features:
Native TensorFlow Support: Optimized for TensorFlow models, but can also serve other types with custom adapters.
Version Management: Supports multiple versions of models, enabling seamless updates and rollbacks.
Performance: Designed for low-latency, high-throughput serving.
Extensibility: Easily integrates with monitoring, logging, and other production systems.
Example: Serving a TensorFlow Model with TensorFlow Serving
bash
Copy Code
# Export your trained model
saved_model_path=”exported_model/1″
# Start TensorFlow Serving Docker container
docker run -p 8501:8501 –name=tf_serving \
-v „$(pwd)/exported_model:/models/my_model” \
-e MODEL_NAME=my_model \
tensorflow/serving
This command serves your model at localhost:8501 via REST and gRPC endpoints.
4.2 TorchServe: PyTorch Model Serving Made Easy
TorchServe is an open-source model serving framework developed by AWS and Facebook, designed for deploying PyTorch models at scale. It simplifies the process of packaging, serving, and scaling PyTorch models in production.
Key Features:
Easy Packaging: Package PyTorch models with custom handlers for preprocessing and postprocessing.
Multi-Model Serving: Serve multiple models simultaneously with version management.
Metrics and Logging: Built-in support for logging, monitoring, and metrics.
Scalability: Supports batch inference and multi-threaded serving.
Example: Serving a PyTorch Model with TorchServe
bash
Copy Code
# Export your model to TorchScript
python model_script.py
# Create a model archive
torch-model-archiver –model-name my_model –version 1.0 –serialized-file model.pt –handler handler.py
# Start TorchServe
torchserve –start –ncs –model-store model_store –models my_model=my_model.mar
This setup serves your PyTorch model and exposes prediction endpoints for integration with applications.
4.3 Seldon Core: Kubernetes-Based Model Deployment
Seldon Core is an open-source platform for deploying, scaling, and managing machine learning models on Kubernetes. It supports models built with any framework and provides advanced deployment patterns for production environments.
Key Features:
Framework Agnostic: Deploy models from TensorFlow, PyTorch, scikit-learn, XGBoost, and more.
Kubernetes Native: Leverages Kubernetes for orchestration, scaling, and management.
Advanced Deployment Patterns: Supports A/B testing, canary releases, and multi-armed bandits.
Monitoring and Logging: Integrates with Prometheus, Grafana, and other observability tools.
Example: Deploying a Model with Seldon Core (YAML)
yaml
Copy Code
apiVersion: machinelearning.seldon.io/v1
kind: SeldonDeployment
metadata:
name: my-model
spec:
predictors:
– name: default
replicas: 2
graph:
children: []
implementation: SKLEARN_SERVER
modelUri: s3://my-bucket/sklearn-model/
name: classifier
Apply this YAML to your Kubernetes cluster to deploy and scale your model with Seldon Core.
Pipeline Orchestration and Automation
As machine learning projects grow in complexity, orchestrating and automating workflows becomes essential for efficiency, reproducibility, and scalability. Pipeline orchestration tools help developers automate data ingestion, preprocessing, model training, evaluation, and deployment—ensuring that every step is executed reliably and in the correct order. In this section, we’ll explore three leading tools for pipeline orchestration and automation: Apache Airflow, Kubeflow, and Prefect.
5.1 Apache Airflow: Workflow Management for Data Pipelines
Apache Airflow is an open-source platform for programmatically authoring, scheduling, and monitoring workflows. It is widely used for managing data engineering and machine learning pipelines.
Key Features:
DAG-Based Workflows: Define workflows as Directed Acyclic Graphs (DAGs) using Python code.
Scheduling: Automate pipeline execution on a schedule or in response to events.
Extensibility: Integrate with a wide range of data sources, cloud services, and ML tools.
Monitoring: Visualize pipeline status, logs, and task dependencies via a web UI.
Example: Simple ML Pipeline with Airflow (Python DAG)
python
Copy Code
from airflow import DAG
from airflow.operators.python import PythonOperator
from datetime import datetime
def preprocess():
print(„Preprocessing data…”)
def train():
print(„Training model…”)
def deploy():
print(„Deploying model…”)
with DAG(’mlops_pipeline’, start_date=datetime(2024, 1, 1), schedule_interval=’@daily’, catchup=False) as dag:
preprocess_task = PythonOperator(task_id=’preprocess’, python_callable=preprocess)
train_task = PythonOperator(task_id=’train’, python_callable=train)
deploy_task = PythonOperator(task_id=’deploy’, python_callable=deploy)
preprocess_task >> train_task >> deploy_task
This DAG automates a simple ML workflow with preprocessing, training, and deployment steps.
5.2 Kubeflow: Machine Learning Workflows on Kubernetes
Kubeflow is an open-source platform for deploying, orchestrating, and managing machine learning workflows on Kubernetes. It is designed to support the entire ML lifecycle, from data preparation to model serving.
Key Features:
Kubernetes Native: Leverages Kubernetes for scalability, portability, and resource management.
Pipeline Automation: Define, run, and track complex ML pipelines with a visual interface or YAML/DSL.
Component Reusability: Build reusable pipeline components for data processing, training, and evaluation.
Integration: Works with TensorFlow, PyTorch, scikit-learn, and other ML frameworks.
Example: Defining a Kubeflow Pipeline (Python DSL)
python
Copy Code
import kfp
from kfp import dsl
@dsl.pipeline(
name=’Simple ML Pipeline’,
description=’An example pipeline with preprocessing, training, and deployment.’
)
def simple_ml_pipeline():
preprocess = dsl.ContainerOp(
name=’Preprocess’,
image=’python:3.9′,
command=[’python’, 'preprocess.py’]
)
train = dsl.ContainerOp(
name=’Train’,
image=’python:3.9′,
command=[’python’, 'train.py’]
)
deploy = dsl.ContainerOp(
name=’Deploy’,
image=’python:3.9′,
command=[’python’, 'deploy.py’]
)
train.after(preprocess)
deploy.after(train)
This pipeline can be compiled and run on a Kubeflow cluster for end-to-end automation.
5.3 Prefect: Modern Dataflow Automation
Prefect is a modern workflow orchestration tool designed for data-intensive and ML workflows. It offers a Pythonic API, dynamic scheduling, and robust error handling.
Key Features:
Python-First: Define workflows as Python code, making it easy to integrate with existing ML scripts.
Dynamic Workflows: Support for parameterized and conditional flows.
Observability: Real-time monitoring, logging, and alerting via Prefect Cloud or Prefect Server.
Fault Tolerance: Automatic retries, failure notifications, and state management.
Example: Orchestrating a Workflow with Prefect
python
Copy Code
from prefect import flow, task
@task
def preprocess():
print(„Preprocessing data…”)
@task
def train():
print(„Training model…”)
@task
def deploy():
print(„Deploying model…”)
@flow
def mlops_pipeline():
preprocess()
train()
deploy()
if __name__ == „__main__”:
mlops_pipeline() This Prefect flow automates the ML pipeline with clear, maintainable Python code
Model Monitoring and Observability
Once a machine learning model is deployed, the work is far from over. Continuous monitoring and observability are essential to ensure that models perform as expected, remain reliable, and deliver business value over time. Effective monitoring helps detect issues such as data drift, model degradation, and infrastructure bottlenecks before they impact users or business outcomes. In this section, we’ll explore three leading tools for model monitoring and observability: Prometheus and Grafana, Evidently AI, and Arize AI.
6.1 Prometheus and Grafana: Monitoring Infrastructure and Model Performance
Prometheus is an open-source monitoring and alerting toolkit, while Grafana is a powerful visualization platform. Together, they provide a robust solution for tracking both infrastructure metrics (CPU, memory, network) and custom application metrics, including those from machine learning models.
Key Features:
Time-Series Data Collection: Prometheus scrapes and stores metrics as time-series data.
Custom Metrics: Developers can expose model-specific metrics (e.g., prediction latency, error rates) via HTTP endpoints.
Alerting: Set up alerts for anomalies or threshold breaches.
Visualization: Grafana dashboards provide real-time insights into model and system health.
Example: Exposing Model Metrics with Prometheus Client in Python
python
Copy Code
from prometheus_client import start_http_server, Summary
import random
import time
REQUEST_TIME = Summary(’request_processing_seconds’, 'Time spent processing request’)
@REQUEST_TIME.time()
def process_request():
time.sleep(random.random())
if __name__ == '__main__’:
start_http_server(8000)
while True:
process_request()
This script exposes a metric that can be scraped by Prometheus and visualized in Grafana.
6.2 Evidently AI: Data and Model Monitoring in Production
Evidently AI is an open-source tool designed specifically for monitoring data quality, detecting data and model drift, and generating reports for machine learning models in production.
Key Features:
Data Drift Detection: Automatically detect changes in input data distributions.
Model Performance Monitoring: Track metrics such as accuracy, precision, recall, and more.
Automated Reporting: Generate interactive dashboards and reports for stakeholders.
Integration: Easily integrates with Python pipelines and Jupyter notebooks.
Example: Generating a Data Drift Report with Evidently AI
python
Copy Code
from evidently.report import Report
from evidently.metric_preset import DataDriftPreset
import pandas as pd
# Load reference and current data
reference = pd.read_csv(„data/reference.csv”)
current = pd.read_csv(„data/current.csv”)
# Create and run report
report = Report(metrics=[DataDriftPreset()])
report.run(reference_data=reference, current_data=current)
report.save_html(„drift_report.html”)
This example generates a data drift report that can be shared with your team.
6.3 Arize AI: End-to-End ML Observability
Arize AI is a commercial platform focused on end-to-end observability for machine learning models. It provides advanced monitoring, analytics, and troubleshooting tools for models in production.
Key Features:
Real-Time Monitoring: Track model predictions, performance, and data quality in real time.
Root Cause Analysis: Quickly identify the source of model issues or performance drops.
Drift and Bias Detection: Monitor for data drift, concept drift, and bias in model predictions.
Collaboration: Share insights and reports across teams for faster resolution.
Example: Logging Model Predictions to Arize AI (Python SDK)
python
Copy Code
from arize.pandas.logger import Client
import pandas as pd
client = Client(space_key=”YOUR_SPACE_KEY”, api_key=”YOUR_API_KEY”)
# Example prediction data
df = pd.DataFrame({
„prediction_id”: [1, 2, 3],
„prediction”: [0, 1, 1],
„actual”: [0, 1, 0]
})
client.log(
dataframe=df,
model_id=”my_model”,
model_version=”v1″,
environment=”production”
)
This code logs predictions and actuals to Arize AI for monitoring and analysis.
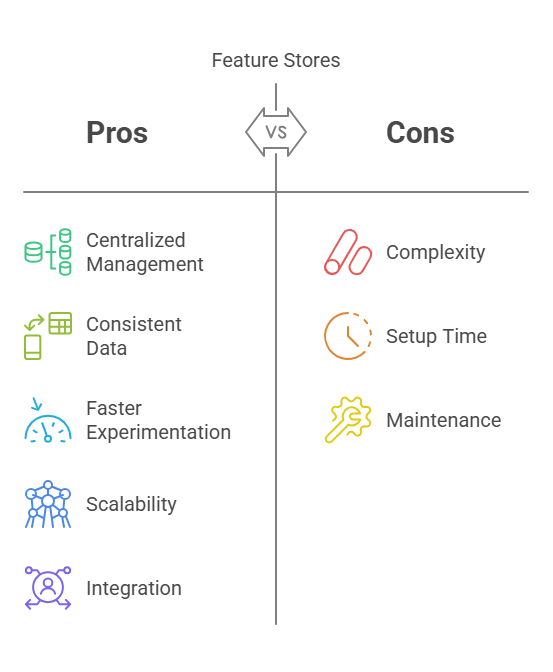
Feature Stores
Feature stores have become a critical component of modern MLOps workflows, enabling teams to manage, reuse, and serve features consistently across the machine learning lifecycle. By centralizing feature engineering and storage, feature stores help ensure that models in development and production use the same, validated data, reducing inconsistencies and accelerating experimentation. In this section, we’ll explore three leading feature store solutions: Feast, Tecton, and Hopsworks.
7.1 Feast: Feature Store for Operational ML
Feast (Feature Store) is an open-source feature store designed to bridge the gap between data engineering and machine learning. It enables teams to store, discover, and serve features for both training and real-time inference.
Key Features:
Centralized Feature Management: Store and manage features in a single repository.
Online and Offline Stores: Serve features for both batch training and low-latency online inference.
Integration: Works with popular data warehouses, databases, and ML frameworks.
Scalability: Designed for production-scale workloads.
Example: Defining and Retrieving Features with Feast (Python)
python
Copy Code
from feast import FeatureStore
# Initialize the feature store
store = FeatureStore(repo_path=”.”)
# Retrieve features for inference
entity_rows = [{„customer_id”: 123}]
features = store.get_online_features(
features=[„customer_features:age”, „customer_features:income”],
entity_rows=entity_rows
).to_dict()
print(features)
Feast makes it easy to ensure that the same features are used during both training and inference, reducing training-serving skew.
7.2 Tecton: Enterprise Feature Store
Tecton is a commercial, enterprise-grade feature store built for large-scale, real-time machine learning applications. It provides advanced capabilities for feature engineering, monitoring, and governance.
Key Features:
Real-Time Feature Pipelines: Build and deploy streaming and batch feature pipelines.
Feature Lineage and Governance: Track the origin and usage of every feature for compliance and reproducibility.
Monitoring: Monitor feature freshness, data quality, and usage.
Integration: Works with cloud data platforms and ML frameworks.
Example: Creating a Feature Pipeline in Tecton (Pseudocode)
python
Copy Code
@batch_feature_view(
sources=[transactions_source],
entities=[customer],
mode=”batch”,
schedule=”1d”
)
def total_spent(transactions):
return transactions.groupby(„customer_id”).sum(„amount”)
Tecton’s declarative approach allows teams to define, monitor, and reuse features at scale.
7.3 Hopsworks: Feature Store for Data-Intensive AI
Hopsworks is an open-source and commercial feature store platform designed for data-intensive AI and big data environments. It supports both batch and real-time feature serving and integrates with a wide range of data sources and ML frameworks.
Key Features:
Data Lake Integration: Connects with data lakes, warehouses, and streaming sources.
Python and Spark APIs: Supports feature engineering in both Python and Spark.
Versioning and Access Control: Manage feature versions and control access for security and compliance.
Monitoring and Visualization: Built-in tools for monitoring feature usage and quality.
Example: Writing and Reading Features with Hopsworks (Python)
python
Copy Code
import hsfs
connection = hsfs.connection()
fs = connection.get_feature_store()
# Write a feature group
feature_group = fs.create_feature_group(
name=”customer_features”,
version=1,
primary_key=[„customer_id”],
description=”Customer demographic features”
)
feature_group.insert(dataframe)
# Read features for training
features = fs.get_feature_group(„customer_features”, version=1)
df = features.read()
Hopsworks provides a unified platform for managing features across the ML lifecycle, from engineering to serving.
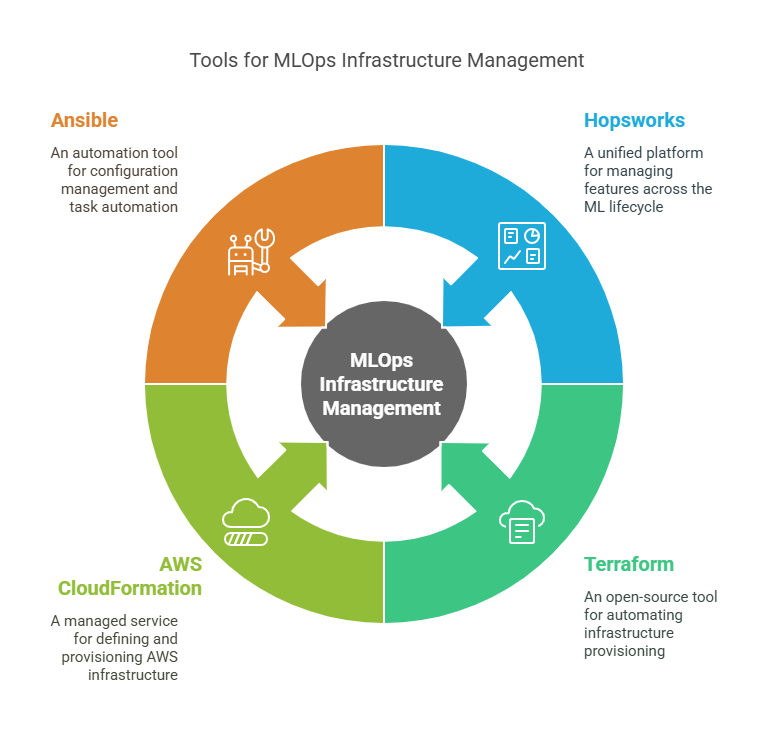
Infrastructure as Code (IaC) for MLOps
Infrastructure as Code (IaC) is a foundational practice in modern MLOps, enabling teams to automate the provisioning, configuration, and management of the infrastructure required for machine learning workflows. By defining infrastructure in code, teams can ensure consistency, repeatability, and scalability across environments—from development to production. In this section, we’ll explore three leading IaC tools for MLOps: Terraform, AWS CloudFormation, and Ansible.
8.1 Terraform: Infrastructure Automation
Terraform is an open-source IaC tool developed by HashiCorp. It allows you to define cloud and on-premises resources using a declarative configuration language (HCL), making it easy to provision and manage infrastructure for ML workloads.
Key Features:
Multi-Cloud Support: Provision resources across AWS, Azure, GCP, and more.
Declarative Syntax: Define infrastructure as code for easy versioning and collaboration.
State Management: Track and manage infrastructure state for reliable updates and rollbacks.
Modularity: Use reusable modules for common infrastructure patterns.
Example: Provisioning an EC2 Instance for ML with Terraform
hcl
Copy Code
provider „aws” {
region = „us-west-2”
}
resource „aws_instance” „ml_server” {
ami = „ami-0abcdef1234567890”
instance_type = „t2.medium”
tags = {
Name = „ML-Server”
}
}
This script provisions an EC2 instance for ML workloads, which can be versioned and reused across projects.
8.2 AWS CloudFormation: Cloud Resource Provisioning
AWS CloudFormation is a managed IaC service that enables you to define and provision AWS infrastructure using JSON or YAML templates. It is tightly integrated with the AWS ecosystem, making it ideal for teams building ML solutions on AWS.
Key Features:
AWS Native: Automate the creation and management of AWS resources.
Template-Driven: Define infrastructure in reusable, shareable templates.
Stack Management: Deploy, update, and delete entire stacks of resources as a single unit.
Integration: Works seamlessly with AWS services like SageMaker, Lambda, and S3.
Example: Creating an S3 Bucket for ML Data with CloudFormation (YAML)
yaml
Copy Code
Resources:
MLDataBucket:
Type: AWS::S3::Bucket
Properties:
BucketName: my-ml-data-bucket
This template creates an S3 bucket for storing ML datasets, models, or artifacts.
8.3 Ansible: Configuration Management
Ansible is an open-source automation tool for configuration management, application deployment, and task automation. It uses simple YAML-based playbooks to define the desired state of systems, making it easy to automate the setup of ML environments.
Key Features:
Agentless: No need to install agents on target machines.
Idempotent: Ensures that repeated runs produce the same result.
Extensible: Supports custom modules and integrations.
Cross-Platform: Manage Linux, Windows, and cloud resources.
Example: Installing Python and ML Libraries with Ansible
yaml
Copy Code
– name: Set up ML environment
hosts: ml_servers
become: yes
tasks:
– name: Install Python 3 and pip
apt:
name:
– python3
– python3-pip
state: present
– name: Install scikit-learn
pip:
name: scikit-learn
This playbook automates the installation of Python and scikit-learn on a group of servers.
Security and Compliance Tools
Security and compliance are critical considerations in any production machine learning environment. As ML models increasingly handle sensitive data and drive business decisions, it’s essential to protect data, control access, and maintain audit trails to meet regulatory requirements. MLOps teams must integrate security and compliance tools into their workflows to safeguard both data and models. In this section, we’ll explore three key areas: data encryption tools, access control and authentication, and audit logging and compliance monitoring.
9.1 Data Encryption Tools
Data encryption is fundamental for protecting sensitive information at rest and in transit. Encryption tools ensure that only authorized users and systems can access raw data, model artifacts, and predictions.
Key Features:
Encryption at Rest: Protects stored data on disks, databases, and cloud storage.
Encryption in Transit: Secures data as it moves between services, APIs, and users.
Integration: Works with cloud storage, databases, and file systems.
Popular Tools:
AWS Key Management Service (KMS): Manages encryption keys for AWS resources.
Azure Key Vault: Centralized key management for Azure services.
OpenSSL: Open-source toolkit for implementing encryption in custom workflows.
Example: Encrypting Data with Python’s cryptography Library
python
Copy Code
from cryptography.fernet import Fernet
# Generate a key and instantiate a Fernet instance
key = Fernet.generate_key()
cipher_suite = Fernet(key)
# Encrypt data
data = b”Sensitive information”
encrypted_data = cipher_suite.encrypt(data)
# Decrypt data
decrypted_data = cipher_suite.decrypt(encrypted_data)
print(decrypted_data.decode())
This example demonstrates basic encryption and decryption of sensitive data.
9.2 Access Control and Authentication
Controlling who can access data, models, and APIs is essential for security and compliance. Access control and authentication tools help enforce policies and prevent unauthorized usage.
Key Features:
Role-Based Access Control (RBAC): Assign permissions based on user roles (e.g., admin, developer, viewer).
API Authentication: Secure model endpoints with API keys, OAuth, or JWT tokens.
Integration: Works with cloud IAM (Identity and Access Management) systems and custom applications.
Popular Tools:
AWS IAM: Manage user access and permissions for AWS resources.
OAuth 2.0 / OpenID Connect: Industry standards for secure API authentication.
Auth0: Cloud-based authentication and authorization platform.
Example: Securing a Flask API with an API Key
python
Copy Code
from flask import Flask, request, jsonify, abort
app = Flask(__name__)
API_KEY = „your_secret_api_key”
@app.route(„/predict”, methods=[„POST”])
def predict():
if request.headers.get(„x-api-key”) != API_KEY:
abort(401)
# Model prediction logic here
return jsonify({„prediction”: 1})
if __name__ == „__main__”:
app.run()
This example restricts access to the prediction endpoint using a simple API key.
9.3 Audit Logging and Compliance Monitoring
Audit logging and compliance monitoring are essential for tracking data access, model usage, and system changes. These tools help organizations meet regulatory requirements, investigate incidents, and maintain transparency.
Key Features:
Comprehensive Logging: Record every access, change, and prediction for traceability.
Automated Alerts: Notify teams of suspicious activity or policy violations.
Compliance Reporting: Generate reports for GDPR, HIPAA, or other regulatory standards.
Popular Tools:
ELK Stack (Elasticsearch, Logstash, Kibana): Centralized logging and visualization.
AWS CloudTrail: Monitors and logs AWS account activity.
Splunk: Enterprise platform for searching, monitoring, and analyzing machine-generated data.
Example: Logging Access and Predictions for Auditing
python
Copy Code
import logging
from flask import Flask, request, jsonify
logging.basicConfig(filename=’audit.log’, level=logging.INFO)
app = Flask(__name__)
@app.route(„/predict”, methods=[„POST”])
def predict():
user = request.headers.get(„user-id”, „unknown”)
data = request.get_json()
# Model prediction logic here
prediction = 1
logging.info(f”User: {user}, Input: {data}, Prediction: {prediction}”)
return jsonify({„prediction”: prediction})
if __name__ == „__main__”:
app.run()
This example logs every prediction request, including user information and input data, supporting traceability and compliance.
Conclusion: Building a Robust MLOps Toolkit
The journey from code to production in machine learning is filled with unique challenges, from managing data and experiments to deploying, monitoring, and securing models at scale. The right MLOps tools empower developers to automate, standardize, and streamline every stage of the ML lifecycle, ensuring that models are reliable, reproducible, and deliver real business value. In this final section, we’ll discuss how to choose the right tools, best practices for integration, and the future of MLOps tooling.
10.1 Choosing the Right Tools for Your Needs
There is no one-size-fits-all solution in MLOps. The best toolkit for your team depends on your specific requirements, existing infrastructure, and the scale of your operations. Consider the following when selecting tools:
Project Scale: Startups may benefit from lightweight, open-source tools, while enterprises might require robust, enterprise-grade platforms with advanced governance and compliance features.
Ecosystem Compatibility: Choose tools that integrate well with your preferred ML frameworks (e.g., TensorFlow, PyTorch, scikit-learn) and cloud providers (AWS, Azure, GCP).
Team Collaboration: Opt for tools that support collaboration, versioning, and experiment tracking to enable seamless teamwork.
Cost and Support: Evaluate the total cost of ownership, including licensing, support, and maintenance.
Tip: Start with a minimal set of tools that solve your immediate pain points, and expand your toolkit as your needs evolve.
10.2 Best Practices for Integrating MLOps Tools
Integrating MLOps tools into your workflow is about more than just installing software—it’s about building reliable, automated, and maintainable processes. Here are some best practices:
Automate Everything: Use CI/CD pipelines to automate data ingestion, model training, testing, deployment, and monitoring.
Version Control: Track code, data, and model artifacts using tools like Git and DVC to ensure reproducibility.
Monitor Continuously: Implement robust monitoring and alerting for both infrastructure and model performance.
Document and Communicate: Maintain clear documentation and foster open communication between data scientists, engineers, and operations teams.
Security and Compliance: Integrate security and compliance checks into every stage of the ML lifecycle.
Example: Simple CI/CD Pipeline for ML with GitHub Actions
yaml
Copy Code
name: ML CI/CD Pipeline
on: [push]
jobs:
build-and-deploy:
runs-on: ubuntu-latest
steps:
– uses: actions/checkout@v2
– name: Set up Python
uses: actions/setup-python@v2
with:
python-version: '3.9′
– name: Install dependencies
run: pip install -r requirements.txt
– name: Run tests
run: pytest tests/
– name: Train model
run: python src/train.py
– name: Deploy model
run: python src/deploy.py
This pipeline automates testing, training, and deployment whenever code is pushed to the repository.
10.3 The Future of MLOps Tooling
The MLOps landscape is evolving rapidly, with new tools and platforms emerging to address the growing complexity of machine learning in production. Key trends shaping the future include:
Greater Automation: Expect more end-to-end automation, from data labeling to model retraining and monitoring.
Unified Platforms: The rise of unified MLOps platforms that cover the entire ML lifecycle, reducing integration overhead.
AI-Assisted Operations: Generative AI and intelligent agents will increasingly assist with monitoring, debugging, and optimization.
Focus on Responsible AI: Tools for explainability, fairness, and compliance will become standard in production ML workflows.
Democratization: No-code and low-code MLOps tools will make advanced ML operations accessible to a broader audience.
Best Practices for Implementing MLOps in FMCG
Tools and Technologies in MLOps for FMCG: A Technical Guide for Developers