

Introduction to MLOps and Automation
Machine learning is transforming industries, but building a model is only the beginning. The real challenge lies in operationalizing machine learning—taking models from development to production, maintaining them, and ensuring they deliver consistent value over time. This is where MLOps (Machine Learning Operations) and automation come into play. In this section, we’ll introduce the concept of MLOps, explain why automation is crucial, and highlight the key benefits of automating the machine learning model lifecycle.
1.1 What is MLOps?
MLOps is a set of practices that combines machine learning, software engineering, and DevOps principles to streamline the end-to-end lifecycle of machine learning models. It covers everything from data collection and model development to deployment, monitoring, and maintenance. The goal of MLOps is to make machine learning workflows more reliable, scalable, and efficient by introducing automation, standardization, and collaboration.
MLOps bridges the gap between data science and IT operations, enabling teams to move models from experimentation to production quickly and safely. It ensures that models are reproducible, auditable, and can be updated or rolled back as needed.
1.2 The Importance of Automation in MLOps
Automation is at the heart of effective MLOps. Manual processes are error-prone, slow, and difficult to scale—especially as the number of models and data sources grows. Automation addresses these challenges by:
Reducing Human Error: Automated pipelines ensure that each step, from data ingestion to deployment, is executed consistently and correctly.
Accelerating Delivery: Automation speeds up the process of training, testing, and deploying models, enabling faster iteration and innovation.
Enabling Scalability: As organizations deploy more models, automation makes it possible to manage and maintain them efficiently without a proportional increase in manual effort.
Supporting Reproducibility: Automated workflows make it easy to reproduce experiments, track changes, and audit results.
Without automation, maintaining high-quality machine learning systems in production becomes nearly impossible.
1.3 Benefits of Automating the ML Model Lifecycle
Automating the machine learning model lifecycle brings significant advantages to organizations and development teams:
Faster Time to Market: Automated pipelines reduce the time required to move models from development to production, allowing businesses to respond quickly to new opportunities and challenges.
Improved Model Quality: Continuous integration and automated testing catch issues early, ensuring that only high-performing models are deployed.
Consistent and Reliable Operations: Automation eliminates variability in processes, leading to more stable and predictable model performance.
Easier Collaboration: Standardized, automated workflows make it easier for data scientists, engineers, and operations teams to work together.
Better Compliance and Governance: Automated tracking of data, code, and model versions supports regulatory compliance and auditability.
Example: Simple Automated Model Training Pipeline in Python
Below is a basic example of how automation can be introduced into the ML lifecycle using Python. This script automates data loading, model training, evaluation, and saving the trained model for deployment.
import pandas as pd
from sklearn.ensemble import RandomForestClassifier
from sklearn.model_selection import train_test_split
import joblib

def load_data(path):
    return pd.read_csv(path)
def train_and_evaluate(X_train, X_test, y_train, y_test):

    model = RandomForestClassifier()
    model.fit(X_train, y_train)
    accuracy = model.score(X_test, y_test)
    return model, accuracy
# Automated pipeline

df = load_data("data/train.csv")

X = df.drop("target", axis=1)

y = df["target"]

X_train, X_test, y_train, y_test = train_test_split(X, y, test_size=0.2)

model, accuracy = train_and_evaluate(X_train, X_test, y_train, y_test)

joblib.dump(model, "models/model.pkl")

print(f"Model trained and saved with accuracy: {accuracy:.2f}")
This example can be extended with automated data validation, experiment tracking, and deployment steps, forming the foundation of a robust MLOps pipeline.
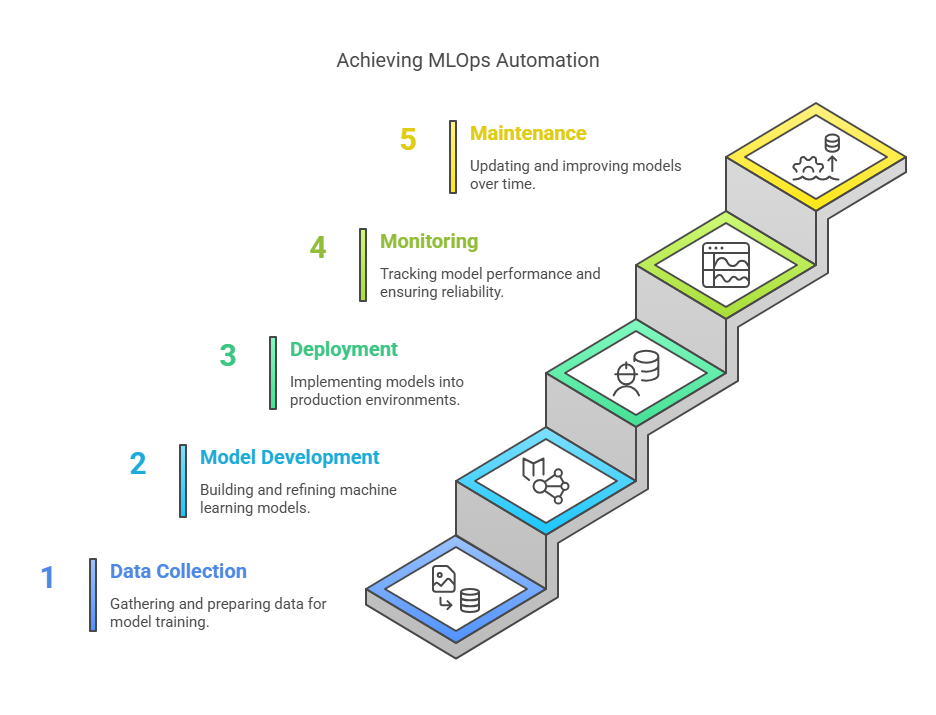
Understanding the Machine Learning Model Lifecycle
The machine learning model lifecycle is a structured process that guides a model from initial data collection to ongoing maintenance in production. Each stage presents unique challenges and opportunities for automation, making it essential for MLOps practitioners to understand the full lifecycle. In this section, we’ll break down the key phases: data collection and preparation, model development and experimentation, model validation and testing, model deployment, and model monitoring and maintenance.
2.1 Data Collection and Preparation
Every machine learning project begins with data. The quality, quantity, and relevance of your data directly impact model performance. Data collection involves gathering raw data from various sources such as databases, APIs, sensors, or user interactions. Preparation includes cleaning, transforming, and engineering features to make the data suitable for modeling.
Automating data collection and preparation ensures consistency and saves time. Tools like Apache Airflow or Prefect can schedule and orchestrate data ingestion and preprocessing pipelines, while libraries like pandas and scikit-learn streamline data cleaning and feature engineering.
Example: Automated Data Preparation in Python
import pandas as pd

def load_and_prepare_data(path):

    df = pd.read_csv(path)

    df = df.dropna()  # Simple cleaning

    df['feature'] = df['feature'].apply(lambda x: x**2)  # Feature engineering

    return df

df = load_and_prepare_data("data/raw_data.csv")

print(df.head())
2.2 Model Development and Experimentation
Once the data is ready, the next step is to develop and experiment with different machine learning models. This phase includes selecting algorithms, tuning hyperparameters, and evaluating model performance. Experiment tracking tools like MLflow or Weights & Biases help log parameters, metrics, and artifacts, making it easier to compare results and reproduce experiments.
Automation in this phase can include automated hyperparameter tuning, parallel experiment runs, and integration with version control systems.
Example: Logging Experiments with MLflow
python
Copy Code
import mlflow
from sklearn.ensemble import RandomForestClassifier
from sklearn.model_selection import train_test_split
X_train, X_test, y_train, y_test = train_test_split(df.drop(„target”, axis=1), df[„target”], test_size=0.2)
mlflow.set_experiment(„Model_Development”)
with mlflow.start_run():
model = RandomForestClassifier(n_estimators=100)
model.fit(X_train, y_train)
accuracy = model.score(X_test, y_test)
mlflow.log_param(„n_estimators”, 100)
mlflow.log_metric(„accuracy”, accuracy)
print(f”Logged experiment with accuracy: {accuracy:.2f}”)
2.3 Model Validation and Testing
Before deploying a model, it must be validated and tested to ensure it meets business and technical requirements. This involves evaluating the model on unseen data, checking for overfitting, and running automated tests to verify performance and robustness.
Automated validation pipelines can include unit tests for data and code, performance benchmarks, and checks for data or concept drift.
Example: Automated Model Validation
python
Copy Code
from sklearn.metrics import classification_report
y_pred = model.predict(X_test)
report = classification_report(y_test, y_pred)
print(report)
2.4 Model Deployment
Deployment is the process of making a trained model available for use in production. This can involve serving the model as an API, integrating it into an application, or scheduling batch predictions. Automation tools like Docker, Kubernetes, and CI/CD pipelines (e.g., GitHub Actions, Jenkins) streamline deployment, ensuring consistency and reliability.
Example: Simple Model Deployment with Flask
python
Copy Code
from flask import Flask, request, jsonify
import joblib
app = Flask(__name__)
model = joblib.load(„models/model.pkl”)
@app.route(„/predict”, methods=[„POST”])
def predict():
data = request.get_json()
prediction = model.predict([data[„features”]])
return jsonify({„prediction”: int(prediction[0])})
if __name__ == „__main__”:
app.run()
2.5 Model Monitoring and Maintenance
After deployment, continuous monitoring is essential to ensure the model performs as expected in the real world. Monitoring includes tracking prediction accuracy, latency, and detecting data or concept drift. Maintenance may involve retraining the model with new data, updating features, or rolling back to previous versions if issues arise.
Automated monitoring tools like Prometheus, Grafana, and Evidently AI can alert teams to performance drops or anomalies, triggering retraining pipelines as needed.
Example: Monitoring Model Inference Time with Prometheus
python
Copy Code
from prometheus_client import start_http_server, Summary
import time
REQUEST_TIME = Summary(’request_processing_seconds’, 'Time spent processing request’)
@REQUEST_TIME.time()
def predict():
# Simulate model inference
time.sleep(0.2)
if __name__ == „__main__”:
start_http_server(8000)
while True:
predict()
By understanding and automating each stage of the machine learning model lifecycle, organizations can build robust, scalable, and maintainable ML systems that deliver consistent value in production.
Automating Data Collection and Preparation
Data collection and preparation are foundational steps in any machine learning project. Automating these processes ensures that data is consistently ingested, validated, and transformed, reducing manual errors and accelerating the path to model development. In this section, we’ll explore how to automate data ingestion, validation and cleaning, as well as data versioning and lineage tracking.
3.1 Data Ingestion Automation
Automating data ingestion means setting up pipelines that fetch data from various sources—such as databases, APIs, files, or streaming platforms—on a regular schedule or in response to events. This ensures that your machine learning workflows always have access to the latest, most relevant data.
Tools like Apache Airflow, Prefect, and cloud-native solutions (e.g., AWS Glue, Google Cloud Dataflow) can orchestrate and automate data ingestion tasks. These tools allow you to schedule jobs, handle dependencies, and monitor pipeline health.
Example: Automated Data Ingestion with Airflow (Python DAG)
python
Copy Code
from airflow import DAG
from airflow.operators.python import PythonOperator
from datetime import datetime
import pandas as pd
def fetch_data():
df = pd.read_csv(„https://example.com/data.csv”)
df.to_csv(„data/raw_data.csv”, index=False)
print(„Data ingested and saved.”)
with DAG(’data_ingestion’, start_date=datetime(2024, 1, 1), schedule_interval=’@daily’, catchup=False) as dag:
ingest_task = PythonOperator(task_id=’fetch_data’, python_callable=fetch_data)
This DAG fetches new data every day and saves it for downstream processing.
3.2 Data Validation and Cleaning Automation
Automated data validation and cleaning are essential for ensuring data quality before it enters the modeling pipeline. Validation checks might include verifying schema, checking for missing or out-of-range values, and ensuring data consistency.
Libraries like Great Expectations, TensorFlow Data Validation, or custom Python scripts can be integrated into your pipelines to automate these checks.
Example: Data Validation with Great Expectations
python
Copy Code
import great_expectations as ge
df = ge.read_csv(„data/raw_data.csv”)
df.expect_column_values_to_not_be_null(„age”)
df.expect_column_values_to_be_between(„salary”, min_value=30000, max_value=200000)
results = df.validate()
print(results)
This script checks for missing values and ensures that salaries fall within a specified range.
3.3 Data Versioning and Lineage Tracking
As data evolves, it’s crucial to track versions and maintain lineage so you can reproduce experiments and audits. Data versioning tools like DVC (Data Version Control) or LakeFS integrate with Git to track changes in datasets and data pipelines.
Lineage tracking documents the flow of data from source to model, supporting transparency and compliance.
Example: Data Versioning with DVC
bash
Copy Code
# Initialize DVC in your project
dvc init
# Add a dataset to DVC tracking
dvc add data/raw_data.csv
# Commit changes to Git
git add data/raw_data.csv.dvc .gitignore
git commit -m „Track raw data with DVC”
With DVC, you can roll back to previous data versions and ensure every model is linked to the exact data used for training.
Automating Model Development and Experimentation
Model development and experimentation are at the heart of any machine learning project. Automating these processes not only accelerates innovation but also ensures reproducibility, consistency, and efficient collaboration across teams. In this section, we’ll explore how to automate experiment tracking, hyperparameter tuning, and model versioning and management.
4.1 Experiment Tracking Tools
Experiment tracking is essential for managing the many iterations and variations that occur during model development. Automated experiment tracking tools log parameters, metrics, code versions, and artifacts for each run, making it easy to compare results and reproduce successful experiments.
Popular tools include MLflow, Weights & Biases, and Neptune.ai. These platforms integrate with your code to automatically capture experiment metadata and provide dashboards for visualization and collaboration.
Example: Tracking Experiments with MLflow
python
Copy Code
import mlflow
from sklearn.ensemble import RandomForestClassifier
from sklearn.model_selection import train_test_split
import pandas as pd
df = pd.read_csv(„data/processed_data.csv”)
X_train, X_test, y_train, y_test = train_test_split(df.drop(„target”, axis=1), df[„target”], test_size=0.2)
mlflow.set_experiment(„Automated_Experiment_Tracking”)
with mlflow.start_run():
model = RandomForestClassifier(n_estimators=100)
model.fit(X_train, y_train)
accuracy = model.score(X_test, y_test)
mlflow.log_param(„n_estimators”, 100)
mlflow.log_metric(„accuracy”, accuracy)
mlflow.sklearn.log_model(model, „model”)
print(f”Experiment logged with accuracy: {accuracy:.2f}”)
4.2 Automated Hyperparameter Tuning
Hyperparameter tuning is the process of finding the best set of parameters for a model. Automating this process saves time and often leads to better-performing models. Tools like Optuna, Hyperopt, and scikit-learn’s GridSearchCV or RandomizedSearchCV can automate hyperparameter optimization.
Example: Automated Hyperparameter Tuning with scikit-learn
python
Copy Code
from sklearn.model_selection import GridSearchCV
param_grid = {
'n_estimators’: [50, 100, 200],
'max_depth’: [None, 10, 20]
}
grid_search = GridSearchCV(RandomForestClassifier(), param_grid, cv=3)
grid_search.fit(X_train, y_train)
print(f”Best parameters: {grid_search.best_params_}”)
print(f”Best accuracy: {grid_search.best_score_:.2f}”)
4.3 Model Versioning and Management
As models evolve, it’s crucial to track different versions and manage their lifecycle. Automated model versioning ensures that every model artifact is linked to the data, code, and parameters used to create it. Model registries, such as MLflow Model Registry or Sagemaker Model Registry, provide centralized management for model versions, stages (e.g., staging, production), and deployment status.
Example: Registering a Model with MLflow Model Registry
python
Copy Code
import mlflow
import mlflow.sklearn
with mlflow.start_run():
model = RandomForestClassifier(n_estimators=100)
model.fit(X_train, y_train)
mlflow.sklearn.log_model(model, „model”, registered_model_name=”ChurnModel”)
print(„Model registered in MLflow Model Registry.”)
Automating Model Validation and Testing
Before a machine learning model can be trusted in production, it must be thoroughly validated and tested. Automating these processes ensures that only high-quality, reliable models are deployed, and that issues are caught early in the workflow. In this section, we’ll explore how to automate unit testing for models, performance testing and benchmarking, and model validation pipelines.
5.1 Automated Unit Testing for Models
Unit testing is a standard practice in software engineering, and it’s equally important in machine learning. Automated unit tests verify that individual components—such as data preprocessing functions, feature engineering steps, and model inference—work as expected. This helps catch bugs early and ensures that changes do not break existing functionality.
Frameworks like pytest can be used to write and run automated tests for ML code.
Example: Unit Test for a Preprocessing Function
python
Copy Code
import pytest
import pandas as pd
def preprocess(df):
df = df.dropna()
df[’feature’] = df[’feature’] ** 2
return df
def test_preprocess():
df = pd.DataFrame({’feature’: [1, 2, None]})
processed = preprocess(df)
assert processed[’feature’].tolist() == [1, 4]
# Run with: pytest test_preprocess.py
5.2 Performance Testing and Benchmarking
Performance testing ensures that models meet required accuracy, latency, and resource usage standards. Automated performance tests can be integrated into CI/CD pipelines to benchmark models on validation datasets and check for regressions.
Example: Automated Model Performance Test
python
Copy Code
from sklearn.metrics import accuracy_score
def test_model_performance(model, X_test, y_test, min_accuracy=0.85):
y_pred = model.predict(X_test)
accuracy = accuracy_score(y_test, y_pred)
assert accuracy >= min_accuracy, f”Model accuracy {accuracy:.2f} is below threshold {min_accuracy}”
# Example usage:
# test_model_performance(trained_model, X_test, y_test)
5.3 Model Validation Pipelines
A model validation pipeline automates the process of evaluating a model on multiple criteria—such as accuracy, fairness, robustness, and compliance—before deployment. These pipelines can include data validation, statistical tests, and business rule checks.
Tools like TensorFlow Data Validation, Great Expectations, and custom Python scripts can be used to build validation pipelines.
Example: Automated Model Validation Pipeline
python
Copy Code
def validate_model(model, X_test, y_test):
from sklearn.metrics import classification_report
y_pred = model.predict(X_test)
report = classification_report(y_test, y_pred, output_dict=True)
# Example check: ensure F1-score for class '1′ is above 0.8
assert report[’1′][’f1-score’] > 0.8, „F1-score for class '1′ is too low”
print(„Model validation passed.”)
# Example usage:
# validate_model(trained_model, X_test, y_test)
Automating Model Deployment
Model deployment is the process of making a trained machine learning model available for use in production environments. Automating deployment ensures that models are delivered quickly, reliably, and consistently, reducing manual errors and enabling rapid iteration. In this section, we’ll explore how to automate deployment using containerization and orchestration, deployment strategies, and Infrastructure as Code (IaC).
6.1 Containerization and Orchestration
Containerization packages a model and its dependencies into a portable unit, ensuring consistency across development, testing, and production environments. Docker is the most popular tool for containerization, while orchestration platforms like Kubernetes manage the deployment, scaling, and monitoring of containers.
Key Benefits:
Portability: Containers run the same way on any infrastructure.
Scalability: Orchestration platforms can automatically scale model serving based on demand.
Isolation: Each model runs in its own environment, reducing conflicts.
Example: Dockerfile for Serving a Model with Flask
dockerfile
Copy Code
FROM python:3.9
WORKDIR /app
COPY requirements.txt .
RUN pip install -r requirements.txt
COPY . .
CMD [„python”, „serve_model.py”]
Example: Simple Flask Model Server
python
Copy Code
from flask import Flask, request, jsonify
import joblib
app = Flask(__name__)
model = joblib.load(„models/model.pkl”)
@app.route(„/predict”, methods=[„POST”])
def predict():
data = request.get_json()
prediction = model.predict([data[„features”]])
return jsonify({„prediction”: int(prediction[0])})
if __name__ == „__main__”:
app.run(host=”0.0.0.0″, port=5000)
6.2 Deployment Strategies (Blue/Green, Canary)
Automated deployment strategies help minimize downtime and risk when releasing new models. Two popular strategies are:
Blue/Green Deployment: Run two identical environments (blue and green). Deploy the new model to the green environment, test it, and then switch traffic from blue to green if everything works as expected.
Canary Deployment: Gradually roll out the new model to a small subset of users or requests. Monitor performance before scaling up to all users.
These strategies can be automated using CI/CD pipelines and orchestration tools.
Example: Kubernetes Deployment YAML for Model Serving
yaml
Copy Code
apiVersion: apps/v1
kind: Deployment
metadata:
name: model-server
spec:
replicas: 3
selector:
matchLabels:
app: model-server
template:
metadata:
labels:
app: model-server
spec:
containers:
– name: model-server
image: myrepo/model-server:latest
ports:
– containerPort: 5000
6.3 Infrastructure as Code (IaC) for Deployment
IaC tools like Terraform, AWS CloudFormation, and Ansible allow you to define and manage deployment infrastructure as code. This ensures that environments are reproducible, versioned, and easy to update or roll back.
Example: Terraform Script for Deploying an EC2 Instance
hcl
Copy Code
provider „aws” {
region = „us-west-2”
}
resource „aws_instance” „ml_server” {
ami = „ami-0abcdef1234567890”
instance_type = „t2.medium”
tags = {
Name = „ML-Model-Server”
}
}
With IaC, you can automate the provisioning of servers, storage, and networking required for model deployment.
Automating Model Monitoring and Maintenance
Once a machine learning model is deployed, the work is far from over. Continuous monitoring and maintenance are essential to ensure that models remain accurate, reliable, and aligned with business goals. Automating these processes allows teams to detect issues early, respond quickly to changes, and keep models performing at their best. In this section, we’ll explore how to automate real-time performance monitoring, drift detection and alerting, and retraining pipelines.
7.1 Real-Time Performance Monitoring
Real-time monitoring tracks key metrics such as prediction accuracy, latency, throughput, and error rates. Automated monitoring systems can alert teams to anomalies or performance drops, enabling rapid response before users are affected.
Tools like Prometheus, Grafana, and cloud-native monitoring solutions can be integrated with model APIs to collect and visualize metrics.
Example: Exposing Model Inference Time with Prometheus in Python
python
Copy Code
from prometheus_client import start_http_server, Summary
import time
REQUEST_TIME = Summary(’request_processing_seconds’, 'Time spent processing request’)
@REQUEST_TIME.time()
def predict():
# Simulate model inference
time.sleep(0.2)
if __name__ == „__main__”:
start_http_server(8000)
while True:
predict()
This script exposes inference time as a Prometheus metric, which can be visualized in Grafana.
7.2 Drift Detection and Alerting
Data drift (changes in input data distribution) and concept drift (changes in the relationship between input and output) can degrade model performance over time. Automated drift detection tools monitor for these changes and trigger alerts or retraining when necessary.
Libraries like Evidently AI, Alibi Detect, or custom statistical tests can be used for drift detection.
Example: Simple Data Drift Detection with SciPy
python
Copy Code
import numpy as np
from scipy.stats import ks_2samp
# Simulated old and new data
old_data = np.random.normal(0, 1, 1000)
new_data = np.random.normal(0.5, 1, 1000)
stat, p_value = ks_2samp(old_data, new_data)
if p_value < 0.05:
print(„Data drift detected!”)
else:
print(„No significant drift detected.”)
7.3 Automated Retraining Pipelines
When drift or performance degradation is detected, automated retraining pipelines can fetch new data, retrain the model, validate its performance, and redeploy it if it meets quality standards. This ensures that models stay up to date with the latest data and business requirements.
Workflow orchestration tools like Apache Airflow, Kubeflow Pipelines, or Prefect can automate retraining schedules and trigger retraining based on monitoring alerts.
Example: Automated Retraining Pipeline with Airflow (Python DAG)
python
Copy Code
from airflow import DAG
from airflow.operators.python import PythonOperator
from datetime import datetime
def retrain_model():
# Placeholder for retraining logic
print(„Retraining model with new data…”)
with DAG(’retraining_pipeline’, start_date=datetime(2024, 1, 1), schedule_interval=’@weekly’, catchup=False) as dag:
retrain_task = PythonOperator(task_id=’retrain_model’, python_callable=retrain_model)
This DAG schedules retraining every week, but it can also be triggered by monitoring alerts.
Tools and Technologies for MLOps Automation
The success of MLOps automation relies heavily on the right set of tools and technologies. These tools help streamline every stage of the machine learning lifecycle—from continuous integration and deployment to pipeline orchestration and monitoring. In this section, we’ll explore some of the most widely used tools for automating MLOps: CI/CD tools, pipeline orchestration tools, and monitoring and observability tools.
8.1 CI/CD Tools (Jenkins, GitLab CI)
Continuous Integration and Continuous Deployment (CI/CD) tools automate the process of building, testing, and deploying machine learning models. They ensure that every code or data change is automatically validated and, if successful, deployed to production.
Jenkins: An open-source automation server that supports building, testing, and deploying ML workflows through plugins and pipelines.
GitLab CI: Integrated with GitLab repositories, it provides pipelines as code, making it easy to automate ML workflows from code commit to deployment.
Example: Simple GitLab CI Pipeline for ML
yaml
Copy Code
stages:
– test
– train
– deploy
test:
stage: test
script:
– pytest tests/
train:
stage: train
script:
– python src/train.py
deploy:
stage: deploy
script:
– python src/deploy.py
This pipeline runs tests, trains the model, and deploys it automatically on every commit.
8.2 Pipeline Orchestration Tools (Airflow, Kubeflow)
Pipeline orchestration tools automate and manage complex, multi-step machine learning workflows. They handle dependencies, scheduling, and error handling, ensuring that each step runs in the correct order and can be retried or resumed if needed.
Apache Airflow: Defines workflows as Directed Acyclic Graphs (DAGs) in Python, ideal for data and ML pipelines.
Kubeflow Pipelines: Built for Kubernetes, it enables scalable, reproducible, and portable ML workflows.
Example: Simple Airflow DAG for ML Pipeline
python
Copy Code
from airflow import DAG
from airflow.operators.python import PythonOperator
from datetime import datetime
def train_model():
print(„Training model…”)
with DAG(’ml_pipeline’, start_date=datetime(2024, 1, 1), schedule_interval=’@daily’, catchup=False) as dag:
train_task = PythonOperator(task_id=’train_model’, python_callable=train_model)
This DAG schedules a model training task to run daily.
8.3 Monitoring and Observability Tools (Prometheus, Grafana)
Monitoring and observability tools track the health and performance of machine learning models and infrastructure in real time. They help detect issues such as latency spikes, prediction errors, or resource bottlenecks, and can trigger alerts or automated responses.
Prometheus: Collects and stores metrics as time-series data, ideal for monitoring model APIs and infrastructure.
Grafana: Visualizes metrics from Prometheus and other sources, providing dashboards and alerting.
Example: Exposing Model Metrics with Prometheus in Python
python
Copy Code
from prometheus_client import start_http_server, Summary
import time
REQUEST_TIME = Summary(’request_processing_seconds’, 'Time spent processing request’)
@REQUEST_TIME.time()
def predict():
time.sleep(0.1)
if __name__ == „__main__”:
start_http_server(8000)
while True:
predict()
This script exposes inference time as a Prometheus metric, which can be visualized in Grafana.
Tools and Technologies for MLOps Automation
Automating the machine learning lifecycle requires a robust set of tools and technologies that streamline development, deployment, and monitoring. The right tools help teams move faster, reduce manual errors, and ensure that models are reliable and scalable in production. In this section, we’ll cover three essential categories: CI/CD tools, pipeline orchestration tools, and monitoring and observability tools.
8.1 CI/CD Tools (Jenkins, GitLab CI)
Continuous Integration and Continuous Deployment (CI/CD) tools are the backbone of automated machine learning workflows. They automate the process of building, testing, and deploying code and models, ensuring that every change is validated and delivered to production efficiently.
Jenkins: An open-source automation server that supports custom pipelines for ML projects. Jenkins can be extended with plugins to handle data science workflows, trigger retraining, and deploy models.
GitLab CI: Integrated with GitLab repositories, it allows you to define pipelines as code, making it easy to automate testing, training, and deployment steps for ML projects.
Example: GitLab CI Pipeline for ML Workflow
yaml
Copy Code
stages:
– test
– train
– deploy
test:
stage: test
script:
– pytest tests/
train:
stage: train
script:
– python src/train.py
deploy:
stage: deploy
script:
– python src/deploy.py
This pipeline runs tests, trains the model, and deploys it automatically on every commit.
8.2 Pipeline Orchestration Tools (Airflow, Kubeflow)
Pipeline orchestration tools manage complex, multi-step machine learning workflows. They handle dependencies, scheduling, and error handling, ensuring that each step runs in the correct order and can be retried or resumed if needed.
Apache Airflow: Defines workflows as Directed Acyclic Graphs (DAGs) in Python, making it ideal for data and ML pipelines.
Kubeflow Pipelines: Built for Kubernetes, it enables scalable, reproducible, and portable ML workflows, supporting both batch and real-time use cases.
Example: Airflow DAG for Model Training
python
Copy Code
from airflow import DAG
from airflow.operators.python import PythonOperator
from datetime import datetime
def train_model():
print(„Training model…”)
with DAG(’ml_pipeline’, start_date=datetime(2024, 1, 1), schedule_interval=’@daily’, catchup=False) as dag:
train_task = PythonOperator(task_id=’train_model’, python_callable=train_model)
This DAG schedules a model training task to run daily.
8.3 Monitoring and Observability Tools (Prometheus, Grafana)
Monitoring and observability tools track the health and performance of machine learning models and infrastructure in real time. They help detect issues such as latency spikes, prediction errors, or resource bottlenecks, and can trigger alerts or automated responses.
Prometheus: Collects and stores metrics as time-series data, ideal for monitoring model APIs and infrastructure.
Grafana: Visualizes metrics from Prometheus and other sources, providing dashboards and alerting.
Example: Exposing Model Metrics with Prometheus in Python
python
Copy Code
from prometheus_client import start_http_server, Summary
import time
REQUEST_TIME = Summary(’request_processing_seconds’, 'Time spent processing request’)
@REQUEST_TIME.time()
def predict():
time.sleep(0.1)
if __name__ == „__main__”:
start_http_server(8000)
while True:
predict()
This script exposes inference time as a Prometheus metric, which can be visualized in Grafana.
Case Studies: Real-World MLOps Automation
Understanding how MLOps automation works in practice is crucial for teams aiming to implement robust, scalable machine learning systems. Real-world case studies demonstrate the tangible benefits of automating the ML lifecycle, from faster deployment to improved model reliability and business impact. In this section, we’ll explore three practical examples: automating fraud detection, recommendation systems, and predictive maintenance.
9.1 Automating Fraud Detection
Fraud detection systems must process large volumes of transactions in real time and adapt quickly to new fraud patterns. Automating the ML lifecycle for fraud detection ensures that models are always up to date and can respond to emerging threats.
Key Automation Steps:
Data Ingestion: Automated pipelines fetch transaction data from databases and streaming sources.
Model Training: Scheduled retraining ensures the model adapts to new fraud tactics.
Deployment: CI/CD pipelines deploy updated models with zero downtime.
Monitoring: Real-time monitoring detects performance drops or data drift.
Example: Automated Retraining Pipeline for Fraud Detection (Airflow DAG)
python
Copy Code
from airflow import DAG
from airflow.operators.python import PythonOperator
from datetime import datetime
def retrain_fraud_model():
# Placeholder for retraining logic
print(„Retraining fraud detection model…”)
with DAG(’fraud_retraining’, start_date=datetime(2024, 1, 1), schedule_interval=’@daily’, catchup=False) as dag:
retrain_task = PythonOperator(task_id=’retrain_fraud_model’, python_callable=retrain_fraud_model)
9.2 Automating Recommendation Systems
Recommendation systems power personalized experiences in e-commerce, media, and more. Automation ensures that recommendations are always relevant and models are retrained as user preferences evolve.
Key Automation Steps:
Data Collection: Automated ingestion of user interactions, ratings, and product data.
Feature Engineering: Scheduled jobs update user and item features.
Model Training and Evaluation: Automated pipelines retrain and validate models on fresh data.
Deployment and A/B Testing: CI/CD pipelines deploy new models and manage A/B tests to compare performance.
Example: Automated Model Deployment with GitLab CI
yaml
Copy Code
stages:
– train
– deploy
train:
stage: train
script:
– python train_recommender.py
deploy:
stage: deploy
script:
– python deploy_recommender.py
9.3 Automating Predictive Maintenance
Predictive maintenance uses ML to anticipate equipment failures and schedule maintenance proactively. Automation is key to processing sensor data, retraining models, and deploying updates without manual intervention.
Key Automation Steps:
Data Ingestion: Automated pipelines collect sensor data from IoT devices.
Data Validation: Automated checks ensure data quality and consistency.
Model Training and Retraining: Scheduled retraining adapts models to new equipment conditions.
Deployment and Monitoring: Automated deployment and monitoring ensure models are always available and accurate.
Example: Monitoring Model Performance with Prometheus
python
Copy Code
from prometheus_client import start_http_server, Gauge
import random
import time
MODEL_ACCURACY = Gauge(’model_accuracy’, 'Current model accuracy’)
def monitor_accuracy():
while True:
accuracy = random.uniform(0.8, 1.0) # Simulated accuracy
MODEL_ACCURACY.set(accuracy)
time.sleep(60)
if __name__ == „__main__”:
start_http_server(8000)
monitor_accuracy()
Best Practices for MLOps Automation
Successfully automating the machine learning lifecycle requires more than just the right tools—it demands a thoughtful approach to process, collaboration, and continuous improvement. By following best practices, teams can maximize the benefits of MLOps automation, reduce risks, and ensure that their ML systems are robust, scalable, and maintainable. In this section, we’ll cover three key best practices: starting small and iterating, prioritizing key automation areas, and fostering collaboration between teams.
10.1 Start Small and Iterate
One of the most effective strategies for implementing MLOps automation is to start with a small, manageable project and gradually expand. Attempting to automate everything at once can lead to complexity, delays, and resistance from the team.
Pilot Projects: Begin with a single use case or workflow, such as automating model retraining or deployment for one model.
Incremental Improvements: Add automation step by step—first automate data ingestion, then model training, then deployment, and so on.
Continuous Feedback: Gather feedback from users and stakeholders after each iteration to refine processes and address pain points.
Example: Incremental Automation Roadmap
Automate data ingestion and validation.
Add experiment tracking and model versioning.
Integrate automated deployment and monitoring.
Expand automation to additional models and workflows.
10.2 Prioritize Key Automation Areas
Not all parts of the ML lifecycle need to be automated at once. Focus on areas that deliver the most value or are most prone to errors and bottlenecks.
High-Impact Steps: Automate repetitive, time-consuming, or error-prone tasks first (e.g., data validation, model deployment).
Bottlenecks: Identify stages where manual intervention slows down the workflow and target them for automation.
Compliance and Security: Prioritize automation for processes that support compliance, auditability, and data security.
Example: Automating Model Deployment with CI/CD
yaml
Copy Code
stages:
– test
– deploy
test:
stage: test
script:
– pytest tests/
deploy:
stage: deploy
script:
– python deploy_model.py
This pipeline ensures that only tested models are deployed, reducing risk and manual effort.
10.3 Foster Collaboration Between Teams
MLOps is inherently cross-functional, involving data scientists, ML engineers, DevOps, and business stakeholders. Effective automation requires strong collaboration and clear communication.
Shared Standards: Develop and document shared standards for code, data, and model management.
Transparent Workflows: Use tools that provide visibility into pipeline status, model versions, and deployment history.
Regular Syncs: Hold regular meetings or reviews to align on goals, share progress, and resolve issues.
Example: Documenting an ML Workflow for Collaboration
markdown
Copy Code
# ML Workflow Documentation
## Data Ingestion
– Automated with Airflow
– Data sources: S3, SQL
## Model Training
– Experiment tracking with MLflow
– Hyperparameter tuning with Optuna
## Deployment
– CI/CD with GitLab CI
– Model served via Docker and Kubernetes
## Monitoring
– Metrics collected with Prometheus
– Dashboards in Grafana
This documentation helps all team members understand and contribute to the workflow.
The Future of MLOps Automation
The field of MLOps is evolving rapidly, driven by advances in AI, cloud computing, and the growing demand for scalable, reliable machine learning systems. As organizations continue to automate more of the ML lifecycle, new trends and technologies are shaping the future of MLOps automation. In this section, we’ll explore three key directions: AI-powered automation, serverless MLOps, and the rise of edge computing in MLOps.
11.1 AI-Powered Automation
AI is increasingly being used to automate and optimize the very processes that support machine learning. AI-powered automation can intelligently manage workflows, detect anomalies, and even suggest improvements to pipelines.
Self-Healing Pipelines: AI agents can monitor ML workflows, detect failures or bottlenecks, and automatically reroute or restart jobs.
Automated Feature Engineering: Tools are emerging that use AI to suggest or generate new features, accelerating model development.
Smart Hyperparameter Tuning: AI-driven optimization algorithms can search hyperparameter spaces more efficiently than traditional methods.
Example: Automated Hyperparameter Tuning with Optuna
python
Copy Code
import optuna
from sklearn.ensemble import RandomForestClassifier
from sklearn.model_selection import cross_val_score
def objective(trial):
n_estimators = trial.suggest_int(’n_estimators’, 50, 200)
max_depth = trial.suggest_int(’max_depth’, 2, 32)
clf = RandomForestClassifier(n_estimators=n_estimators, max_depth=max_depth)
return cross_val_score(clf, X, y, n_jobs=-1, cv=3).mean()
study = optuna.create_study(direction=’maximize’)
study.optimize(objective, n_trials=20)
print(„Best parameters:”, study.best_params)
11.2 Serverless MLOps
Serverless computing is transforming how ML workloads are deployed and managed. In a serverless MLOps setup, infrastructure management is abstracted away, allowing teams to focus on code and models rather than servers and scaling.
On-Demand Scaling: Serverless platforms automatically scale resources up or down based on demand, optimizing cost and performance.
Event-Driven Workflows: ML pipelines can be triggered by events (e.g., new data arrival), making workflows more responsive and efficient.
Simplified Operations: No need to manage servers, patch operating systems, or handle scaling manually.
Example: Deploying a Model with AWS Lambda (Pseudocode)
python
Copy Code
import json
import joblib
def lambda_handler(event, context):
model = joblib.load(„/opt/model.pkl”)
data = json.loads(event[’body’])
prediction = model.predict([data[’features’]])
return {
'statusCode’: 200,
'body’: json.dumps({’prediction’: int(prediction[0])})
}
11.3 Edge Computing and MLOps
Edge computing brings ML models closer to where data is generated—on devices, sensors, or local servers—reducing latency and enabling real-time decision-making. MLOps for edge environments introduces new challenges and opportunities.
Low Latency Inference: Models deployed at the edge can make predictions in milliseconds, critical for applications like autonomous vehicles or industrial automation.
Decentralized Management: Automated tools are emerging to manage, update, and monitor models across thousands of distributed devices.
Resource Constraints: Edge MLOps must account for limited compute, memory, and power, requiring lightweight models and efficient deployment strategies.
Example: Exporting a Model for Edge Deployment with TensorFlow Lite
python
Copy Code
import tensorflow as tf
# Load a trained model
model = tf.keras.models.load_model(’my_model.h5′)
# Convert to TensorFlow Lite format
converter = tf.lite.TFLiteConverter.from_keras_model(model)
tflite_model = converter.convert()
# Save the model
with open(’model.tflite’, 'wb’) as f:
f.write(tflite_model)
Conclusion: Embracing Automation for MLOps Success
As machine learning becomes a core driver of business value, the need for robust, automated MLOps practices has never been greater. Automation transforms the machine learning lifecycle from a series of manual, error-prone steps into a streamlined, reliable, and scalable process. In this final section, we’ll summarize the key takeaways from this guide and outline practical next steps for implementing MLOps automation in your organization.
12.1 Key Takeaways
Automation is Essential: Automating the ML lifecycle—from data ingestion to monitoring—reduces manual effort, minimizes errors, and accelerates time to value.
Tooling Matters: The right combination of CI/CD, orchestration, monitoring, and versioning tools is crucial for building scalable and maintainable ML systems.
Iterative Approach: Start small, automate high-impact areas first, and expand automation as your needs grow.
Collaboration is Key: Successful MLOps requires close collaboration between data scientists, engineers, DevOps, and business stakeholders.
Continuous Improvement: Regularly review and refine your MLOps processes to adapt to new challenges, technologies, and business goals.
12.2 Next Steps for Implementing MLOps Automation
Assess Your Current Workflow: Identify manual bottlenecks, pain points, and areas where automation can deliver the most value.
Select the Right Tools: Choose tools that fit your team’s needs, infrastructure, and skill sets. Consider open-source and cloud-native options for flexibility and scalability.
Pilot and Iterate: Start with a pilot project—such as automating model retraining or deployment for a single use case. Gather feedback, measure results, and iterate.
Document and Standardize: Create clear documentation and standards for your automated workflows to ensure consistency and facilitate onboarding.
Scale and Evolve: Gradually expand automation to cover more models, data sources, and business processes. Stay informed about new MLOps trends and technologies.
Example: Simple MLOps Automation Roadmap
markdown
Copy Code
1. Automate data ingestion and validation with Airflow.
2. Integrate experiment tracking using MLflow.
3. Set up CI/CD pipelines for model deployment with GitLab CI.
4. Implement real-time monitoring with Prometheus and Grafana.
5. Schedule regular reviews to improve and expand automation.
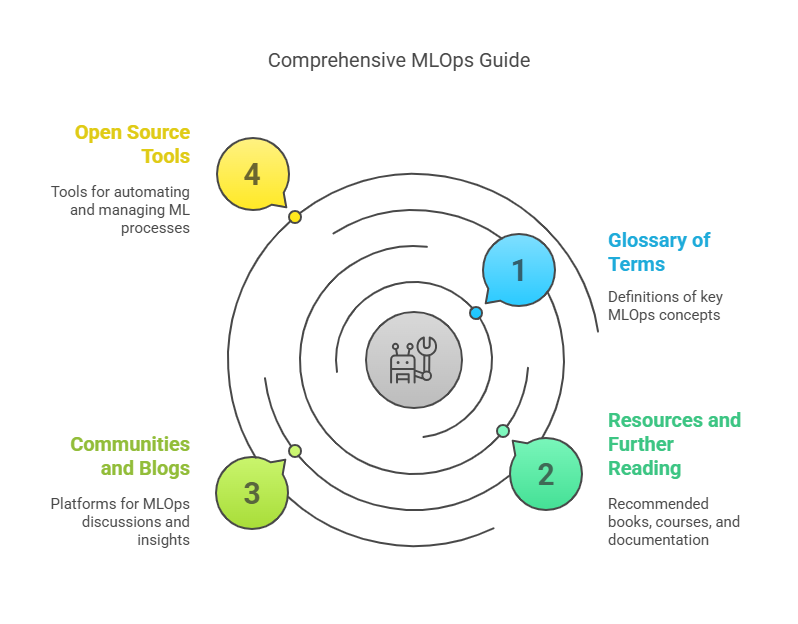
Appendix
The appendix provides additional resources, definitions, and references to support your journey in automating the machine learning model lifecycle. Whether you’re new to MLOps or looking to deepen your expertise, this section will help clarify key concepts and point you toward further learning.
13.1 Glossary of Terms
MLOps: A set of practices that combines machine learning, software engineering, and DevOps to automate and manage the ML lifecycle.
CI/CD (Continuous Integration/Continuous Deployment): Automated processes for integrating code changes, testing, and deploying applications or models.
Pipeline Orchestration: The automation and management of multi-step workflows, such as data processing, model training, and deployment.
Model Registry: A centralized system for storing, versioning, and managing machine learning models.
Data Drift: A change in the distribution of input data, which can negatively impact model performance.
Concept Drift: A change in the relationship between input data and target variables over time.
Feature Store: A centralized repository for storing, sharing, and serving features used in machine learning models.
Infrastructure as Code (IaC): Managing and provisioning computing infrastructure through machine-readable configuration files.
Blue/Green Deployment: A deployment strategy that reduces downtime and risk by running two identical environments and switching traffic between them.
Canary Deployment: A deployment strategy that gradually rolls out changes to a small subset of users before a full rollout.
Drift Detection: Automated monitoring for changes in data or model performance.
Experiment Tracking: Logging and managing the parameters, code, and results of machine learning experiments for reproducibility.
13.2 Resources and Further Reading
Books:
Practical MLOps by Noah Gift, Alfredo Deza
Machine Learning Engineering by Andriy Burkov
Introducing MLOps by Mark Treveil, Alok Shukla
Online Courses:
Coursera: MLOps Specialization by DeepLearning.AI
Udacity: Machine Learning DevOps Engineer Nanodegree
Documentation and Guides:
MLflow Documentation
Kubeflow Pipelines Documentation
TensorFlow Extended (TFX) Guide
Communities and Blogs:
MLOps Community
Towards Data Science: MLOps
Google Cloud Blog: MLOps
Open Source Tools:
MLflow
Apache Airflow
DVC (Data Version Control)
Evidently AI
Best Practices for Implementing MLOps in FMCG
Leveraging MLOps in the FMCG Industry: Key Benefits, Tools, and Practical Examples