

Introduction: The Role of Observability in MLOps
Observability in MLOps is rapidly becoming a foundational requirement for organizations deploying machine learning models and pipelines at scale. As ML systems move from research to production, the complexity of data flows, model dependencies, and real-time decision-making increases dramatically. Traditional monitoring—focused only on system uptime or basic metrics—is no longer enough. Instead, comprehensive observability is needed to ensure reliability, transparency, and business value.
What is Observability in MLOps?
Observability in MLOps refers to the ability to gain deep, actionable insights into the health, performance, and behavior of machine learning models and pipelines. It goes beyond simple monitoring by capturing and correlating metrics, logs, and traces across the entire ML lifecycle—from data ingestion and feature engineering to model training, deployment, and inference.
Why Is Observability Essential?
Without robust observability, teams may miss early warning signs of data drift, model degradation, or pipeline failures. This can lead to silent errors, compliance risks, and lost business opportunities. Observability enables proactive detection of issues, root cause analysis, and rapid incident response. It also supports continuous improvement by providing feedback loops for retraining, tuning, and pipeline optimization.
Key Benefits of Observability in MLOps
Early Detection of Issues: Identify data quality problems, model drift, or performance drops before they impact users.
Faster Troubleshooting: Correlate logs, metrics, and traces to quickly diagnose and resolve incidents.
Transparency and Trust: Provide stakeholders with clear, auditable insights into how models and pipelines are behaving in production.
Regulatory Compliance: Maintain detailed records for audits, explainability, and governance requirements.
Key Components of Observability for ML Systems
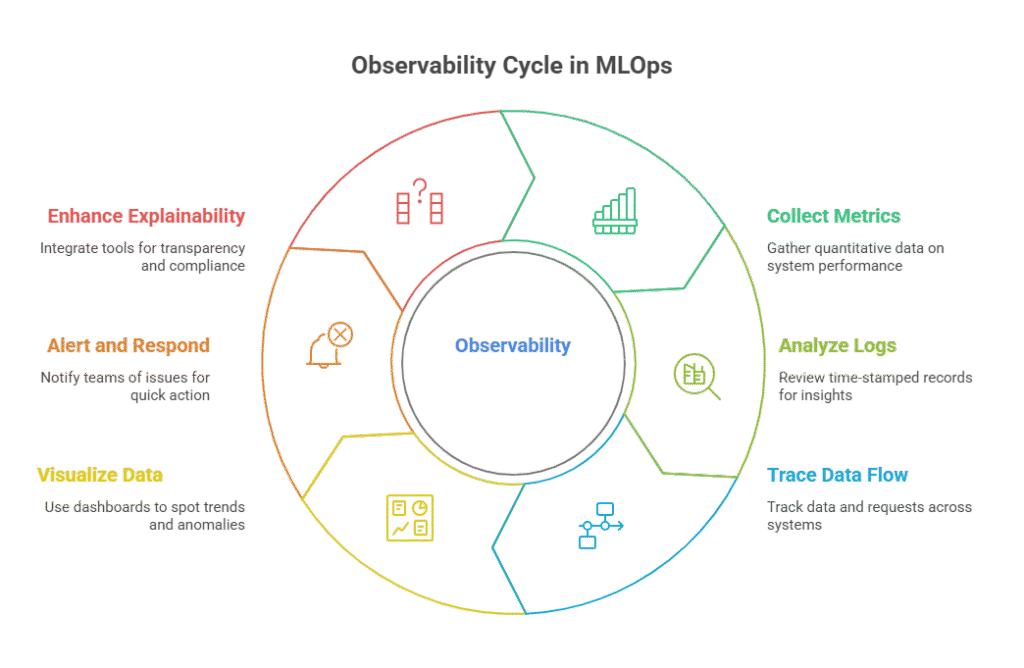
Observability in MLOps is built on three foundational pillars: metrics, logs, and traces. Together, these components provide a comprehensive view of the health, performance, and behavior of machine learning models and pipelines in production.
Metrics are quantitative measurements that track the performance and resource usage of ML systems. In MLOps, key metrics include model accuracy, latency, throughput, error rates, data drift scores, and resource utilization (CPU, memory, GPU). Monitoring these metrics helps teams detect anomalies, performance degradation, and bottlenecks in real time.
Logs capture detailed, time-stamped records of events, errors, and system activities throughout the ML workflow. They are essential for debugging, auditing, and compliance. In ML pipelines, logs might include data ingestion events, feature engineering steps, model training outputs, prediction requests, and error messages. Centralized log aggregation and searchability are crucial for effective troubleshooting.
Traces provide end-to-end visibility into the flow of data and requests across distributed ML systems. Tracing allows teams to follow a single prediction or data batch as it moves through various pipeline components, revealing dependencies, latencies, and failure points. This is especially valuable in complex, microservices-based ML architectures.
Additional Components:
Dashboards and Visualization: Real-time dashboards (e.g., Grafana, Kibana) help teams visualize metrics, logs, and traces, making it easier to spot trends and anomalies.
Alerting and Incident Response: Automated alerts notify teams of critical issues, enabling rapid response and minimizing downtime.
Explainability and Auditability: Integrating explainability tools (like SHAP or LIME) and maintaining audit trails further enhance observability, supporting transparency and regulatory compliance.
Metrics, Logs, and Traces: What to Monitor in ML Pipelines
Effective observability in MLOps starts with knowing what to monitor in your machine learning pipelines. The three pillars—metrics, logs, and traces—provide the foundation for detecting issues, optimizing performance, and ensuring reliable, transparent ML operations.
Metrics: The Pulse of Your ML System
Metrics are quantitative indicators that track the health and performance of your ML models and pipelines. Key metrics to monitor include:
Model performance: Accuracy, precision, recall, F1-score, AUC, and business-specific KPIs (e.g., conversion rate, fraud detection rate).
Data drift and feature statistics: Distribution changes, missing values, outlier rates, and feature importance scores.
Operational metrics: Latency, throughput, error rates, resource utilization (CPU, GPU, memory), and queue lengths.
Serving metrics: Number of predictions served, request/response times, and cache hit rates.
Logs: The Detailed Record of Events
Logs capture granular, time-stamped information about every step in your ML workflow. What to log:
Data pipeline events: Ingestion, transformation, validation, and failures.
Model training and evaluation: Hyperparameters, training duration, evaluation results, and warnings.
Prediction requests: Input data, prediction outputs, errors, and user feedback.
System events: Deployment actions, scaling events, and infrastructure changes.
Centralized log aggregation (using tools like ELK Stack or cloud-native logging) enables fast search, filtering, and root cause analysis.
Traces: End-to-End Visibility
Traces follow the journey of a single request or data batch through the entire ML pipeline, revealing dependencies, latencies, and bottlenecks. Tracing is especially valuable in distributed or microservices-based ML architectures, where a single prediction may touch multiple services and components.
Monitoring Model Performance: Accuracy, Drift, and Latency
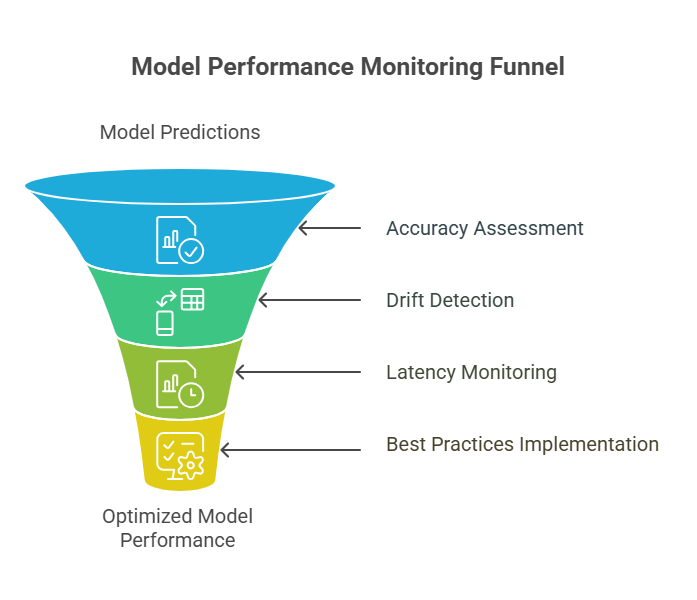
Monitoring model performance is a cornerstone of observability in MLOps. In production, it’s not enough to know that your machine learning pipeline is running—you need to ensure that your models are delivering accurate, reliable, and timely predictions. The three most critical aspects to monitor are accuracy, drift, and latency.
Accuracy: The Foundation of Model Trust
Accuracy and related metrics (precision, recall, F1-score, AUC) are the primary indicators of how well your model is performing on real-world data. In production, it’s essential to track these metrics not just on historical validation sets, but also on live or recent data. This helps detect performance degradation early, whether due to changing data patterns, model staleness, or upstream data quality issues.
Drift: Detecting When the World Changes
Data drift and concept drift occur when the statistical properties of input data or the relationship between features and targets change over time. Drift can silently erode model performance, leading to inaccurate or biased predictions. Monitoring for drift involves:
Comparing feature distributions between training and production data (using statistical tests like KS test or PSI).
Tracking model prediction distributions and output probabilities.
Setting up automated alerts when drift exceeds predefined thresholds.
Latency: Ensuring Timely Predictions
Latency measures the time it takes for a model to generate predictions. High latency can degrade user experience, break SLAs, or cause downstream system failures. Monitor:
Prediction latency: Time from request to response for each prediction.
Batch processing time: Duration for scheduled or bulk inference jobs.
Resource bottlenecks: CPU, GPU, or memory saturation that can increase latency.
Best Practices for Performance Monitoring
Automate metric collection for accuracy, drift, and latency at every stage of the pipeline.
Visualize trends in dashboards (e.g., Grafana, Kibana) for real-time insights.
Set up alerts for metric thresholds, sudden drops, or spikes.
Correlate performance metrics with logs and traces for rapid root cause analysis.
Tools and Frameworks for ML Observability
Implementing comprehensive observability in MLOps requires the right combination of tools and frameworks. The landscape includes both open-source solutions and cloud-native platforms, each offering different strengths for monitoring ML models and pipelines. Choosing the right tools depends on your infrastructure, team expertise, and specific observability requirements.
Open Source Observability Tools
Prometheus and Grafana form a powerful combination for metrics collection and visualization. Prometheus scrapes metrics from ML services, while Grafana provides customizable dashboards for real-time monitoring. This stack is particularly popular for Kubernetes-based ML deployments.
ELK Stack (Elasticsearch, Logstash, Kibana) offers comprehensive log aggregation, search, and visualization. For ML pipelines, this enables centralized logging of training events, prediction requests, and system errors, making troubleshooting faster and more effective.
Jaeger and OpenTelemetry provide distributed tracing capabilities, essential for understanding request flows in complex, microservices-based ML architectures. They help identify bottlenecks and dependencies across the entire pipeline.
Cloud-Native Observability Platforms
AWS CloudWatch, Azure Monitor, and Google Cloud Monitoring offer managed observability services with built-in integration for their respective ML platforms (SageMaker, Azure ML, Vertex AI). These provide out-of-the-box monitoring for model endpoints, training jobs, and infrastructure.
Specialized ML Observability Tools
Evidently AI, WhyLabs, and Arize focus specifically on ML model monitoring, offering features like drift detection, model performance tracking, and explainability dashboards. These tools are designed to understand the unique challenges of monitoring ML systems.
Example: Setting Up Basic ML Monitoring with Python
Here’s a simple Python example demonstrating how to implement basic model monitoring using Prometheus metrics:
python

import time

import random

from prometheus_client import Counter, Histogram, Gauge, start_http_server

import numpy as np

# Define Prometheus metrics

prediction_counter = Counter('ml_predictions_total', 'Total number of predictions')

prediction_latency = Histogram('ml_prediction_duration_seconds', 'Prediction latency')

model_accuracy = Gauge('ml_model_accuracy', 'Current model accuracy')

data_drift_score = Gauge('ml_data_drift_score', 'Data drift score')

class MLModelMonitor:

    def __init__(self):

        self.baseline_mean = 0.5

        self.baseline_std = 0.2

    def predict_with_monitoring(self, input_data):

        """Make prediction with monitoring"""

        start_time = time.time()

        # Simulate model prediction

        prediction = self._simulate_prediction(input_data)

        # Record metrics

        prediction_counter.inc()

        prediction_latency.observe(time.time() - start_time)

        # Check for data drift

        drift_score = self._calculate_drift(input_data)

        data_drift_score.set(drift_score)

        return prediction

    def _simulate_prediction(self, input_data):

        """Simulate model prediction"""

        time.sleep(random.uniform(0.01, 0.1))  # Simulate processing time

        return random.choice([0, 1])

    def _calculate_drift(self, input_data):

        """Simple drift detection using statistical distance"""

        current_mean = np.mean(input_data)

        current_std = np.std(input_data)

        # Calculate drift score (simplified)

        mean_drift = abs(current_mean - self.baseline_mean)

        std_drift = abs(current_std - self.baseline_std)

        return (mean_drift + std_drift) / 2

    def update_accuracy(self, true_labels, predictions):

        """Update model accuracy metric"""

        accuracy = np.mean(np.array(true_labels) == np.array(predictions))

        model_accuracy.set(accuracy)

        print(f"Model accuracy updated: {accuracy:.3f}")

def simulate_ml_service():

    """Simulate ML service with monitoring"""

    monitor = MLModelMonitor()

    print("Starting ML service with monitoring...")

    print("Metrics available at http://localhost:8000")

    # Start Prometheus metrics server

    start_http_server(8000)

    # Simulate predictions

    for i in range(100):

        # Generate sample input data

        input_data = np.random.normal(0.5, 0.2, 10)

        # Make prediction with monitoring

        prediction = monitor.predict_with_monitoring(input_data)

        # Simulate accuracy updates (every 10 predictions)

        if i % 10 == 0:

            true_labels = [random.choice([0, 1]) for _ in range(10)]

            predictions = [random.choice([0, 1]) for _ in range(10)]

            monitor.update_accuracy(true_labels, predictions)

        time.sleep(0.5)  # Simulate request interval

if __name__ == "__main__":

    simulate_ml_service()

# Created/Modified files during execution:

print("ml_monitoring.py")
Setting Up Dashboards and Automated Alerts
Setting up dashboards and automated alerts is a crucial step in achieving true observability for machine learning models and pipelines. Dashboards provide real-time visibility into system health, model performance, and data quality, while automated alerts ensure that teams can respond quickly to anomalies, failures, or drift—before they impact business outcomes.
Why Dashboards Matter in ML Observability
Dashboards aggregate and visualize key metrics, logs, and traces from across your ML infrastructure. They help teams:
Monitor model accuracy, latency, and drift in real time
Track resource utilization and system bottlenecks
Visualize data quality and feature statistics
Correlate events across different pipeline components
Popular tools for building dashboards include Grafana, Kibana, and cloud-native solutions like AWS CloudWatch Dashboards or Google Cloud Monitoring. These platforms support customizable panels, real-time updates, and integration with a wide range of data sources.
Automated Alerts: Proactive Incident Response
Automated alerts are essential for minimizing downtime and ensuring model reliability. By configuring thresholds for critical metrics (e.g., accuracy drop, latency spike, data drift), teams can receive instant notifications via email, Slack, PagerDuty, or other channels. This enables rapid investigation and remediation, reducing the risk of silent failures.
Best Practices for Dashboards and Alerts
Choose actionable metrics: Focus on metrics that directly impact business value or system reliability.
Set meaningful thresholds: Avoid alert fatigue by tuning thresholds to minimize false positives.
Automate alert routing: Integrate with incident management tools for efficient escalation and response.
Continuously review and update: Regularly refine dashboards and alert rules as your ML workflows evolve.
Example: Simple Python Alert for Model Accuracy Drop
Here’s a concise Python example that simulates monitoring model accuracy and sending an alert if it drops below a threshold:
python

import smtplib

from email.mime.text import MIMEText

def send_alert(subject, message, to_email):

    # Configure your SMTP server here

    smtp_server = "smtp.example.com"

    from_email = "mlops-alerts@example.com"

    msg = MIMEText(message)

    msg["Subject"] = subject

    msg["From"] = from_email

    msg["To"] = to_email

    # For demo purposes, just print the alert

    print(f"ALERT: {subject}\n{message}")

def monitor_accuracy(current_accuracy, threshold=0.85):

    if current_accuracy < threshold:

        send_alert(

            subject="Model Accuracy Alert",

            message=f"Model accuracy dropped to {current_accuracy:.2f} (threshold: {threshold})",

            to_email="mlops-team@example.com"

        )

    else:

        print(f"Model accuracy OK: {current_accuracy:.2f}")

# Example usage

monitor_accuracy(0.82)
Root Cause Analysis and Incident Response in ML Workflows
Root cause analysis (RCA) and incident response are essential components of observability in MLOps. As machine learning models and pipelines become more complex and business-critical, the ability to quickly diagnose and resolve issues is vital for minimizing downtime, maintaining trust, and ensuring reliable AI-driven operations.
Why Root Cause Analysis Matters in ML
ML systems can fail or degrade for many reasons: data drift, feature pipeline errors, model staleness, infrastructure outages, or integration bugs. Unlike traditional software, ML incidents often involve subtle changes in data or model behavior that are not immediately obvious. Without systematic RCA, teams may waste valuable time chasing symptoms instead of addressing the underlying problem.
Integrating Observability with CI/CD and Model Registry
Integrating observability with CI/CD pipelines and model registries is a best practice for building robust, production-ready MLOps workflows. This integration ensures that every model version is not only tested and deployed automatically, but also continuously monitored for performance, reliability, and compliance throughout its lifecycle.
Why Integration Matters
When observability is tightly coupled with CI/CD and model registry processes, teams gain end-to-end visibility and control. This means:
Every model registered and deployed is automatically tracked for key metrics, drift, and anomalies.
Issues are detected early, enabling rapid rollback or retraining.
Audit trails and compliance requirements are met, as all actions and model states are logged and traceable.
How to Integrate Observability with CI/CD and Model Registry
Automated Metric Collection in CI/CD:
During model training and validation steps in your CI/CD pipeline, automatically log performance metrics (accuracy, precision, drift scores) to your observability platform and model registry.
Continuous Monitoring Post-Deployment:
Once a model is deployed (via CI/CD), observability tools should monitor live predictions, latency, and data quality. Alerts can be configured to trigger rollback or retraining workflows if issues are detected.
Model Registry Integration:
Store not only the model artifact but also associated metrics, logs, and monitoring configurations in the registry. This provides a single source of truth for model lineage, performance history, and deployment status.
Automated Rollback and Promotion:
If observability tools detect a performance drop or anomaly, the CI/CD pipeline can automatically roll back to a previous model version from the registry, or promote a new candidate model that passes all checks.
Example: Python Pseudocode for Integration
python

def ci_cd_pipeline(model, X_test, y_test, model_registry, observability_tool):

    # Step 1: Evaluate and log metrics

    accuracy = model.score(X_test, y_test)

    observability_tool.log_metric("accuracy", accuracy)

    model_registry.register_model(model, metrics={"accuracy": accuracy})

    # Step 2: Deploy model if it meets threshold

    if accuracy > 0.85:

        deploy_model(model)

        observability_tool.start_monitoring(model)

    else:

        print("Model did not meet accuracy threshold; not deployed.")

    # Step 3: Monitor in production

    if observability_tool.detect_drift(model):

        print("Drift detected! Rolling back to previous model.")

        previous_model = model_registry.get_previous_production_model()

        deploy_model(previous_model)
Security, Compliance, and Auditability in ML Monitoring
Security, compliance, and auditability are non-negotiable requirements for any organization deploying machine learning models in production—especially in regulated industries like finance, healthcare, or government. As ML monitoring becomes more sophisticated, integrating these pillars into your observability stack is essential for protecting sensitive data, meeting legal obligations, and building trust in AI-driven systems.
Security in ML Monitoring
Data Encryption: All monitoring data—including logs, metrics, and traces—should be encrypted both at rest and in transit. This protects sensitive information from unauthorized access or breaches.
Access Control: Implement role-based access control (RBAC) to restrict who can view, modify, or export monitoring data. Integrate with enterprise identity providers (SSO, LDAP, OAuth) for centralized user management.
Network Security: Use private endpoints, VPNs, or VPC peering to ensure that monitoring tools and dashboards are only accessible from trusted networks.
Compliance Considerations
Data Residency and Retention: Ensure that monitoring data is stored in compliance with regional data residency laws (e.g., GDPR, HIPAA). Set up automated data retention policies to delete logs and metrics after a defined period.
Audit Trails: Maintain immutable, tamper-proof logs of all monitoring activities, including who accessed data, what changes were made, and when. This is critical for regulatory audits and incident investigations.
Explainability and Fairness: Integrate explainability tools (like SHAP or LIME) into your monitoring stack to provide transparent, auditable insights into model decisions. This supports compliance with emerging AI regulations and ethical standards.
Auditability in Practice
Comprehensive Logging: Log every action related to model monitoring, including configuration changes, alert acknowledgments, and user access.
Automated Compliance Checks: Use automated scripts or monitoring rules to regularly check for compliance violations (e.g., unauthorized access, missing audit logs, data retention breaches).
Reporting and Documentation: Generate regular compliance reports and maintain clear documentation of your monitoring and audit processes.
Example: Python Script for Audit Logging
Here’s a simple Python example that logs access to monitoring data for audit purposes:
python

from datetime import datetime

def log_audit_event(user, action, resource):

    timestamp = datetime.now().isoformat()

    log_entry = f"{timestamp} | USER: {user} | ACTION: {action} | RESOURCE: {resource}"

    with open("ml_audit_log.txt", "a") as f:

        f.write(log_entry + "\n")

    print(f"Audit log: {log_entry}")

# Example usage

log_audit_event("alice", "viewed_dashboard", "model_performance_metrics")

log_audit_event("bob", "exported_logs", "prediction_latency")
Best Practices
Encrypt all monitoring data and restrict access to authorized users only.
Automate compliance checks and maintain detailed audit logs.
Regularly review and update security and compliance policies as regulations evolve.
Integrate explainability and fairness monitoring to support ethical AI practices.
Case Studies: Real-World ML Observability Implementations
Real-world case studies highlight how organizations are leveraging observability to ensure the reliability, transparency, and business value of their machine learning systems. Below are examples from different industries, each demonstrating best practices and lessons learned in implementing comprehensive ML monitoring and observability.
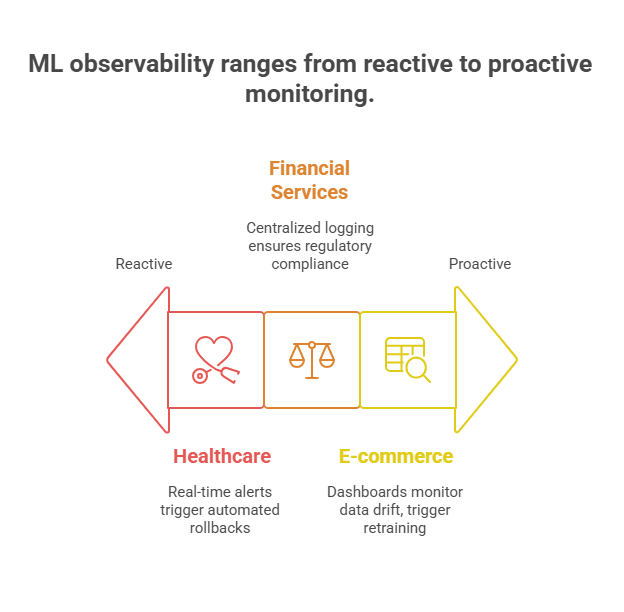
Case Study 1: E-commerce – Proactive Model Drift Detection
A leading e-commerce company deployed a recommendation engine that served millions of users daily. Initially, the team relied on basic accuracy metrics, but as the user base grew, they noticed a gradual decline in conversion rates. By integrating Prometheus and Grafana dashboards with their ML pipeline, they began monitoring not only accuracy but also feature distributions and data drift using the Population Stability Index (PSI). Automated alerts notified the team when drift exceeded a threshold, triggering retraining workflows. As a result, the company reduced revenue loss from stale models and improved user engagement.
Key Takeaways:
Monitor both model performance and data drift in real time.
Use automated alerts to trigger retraining and minimize business impact.
Visualize trends with dashboards for faster root cause analysis.
Case Study 2: Financial Services – End-to-End Auditability and Compliance
A financial institution needed to comply with strict regulatory requirements for its credit risk models. The team implemented centralized logging using the ELK Stack (Elasticsearch, Logstash, Kibana) and integrated audit trails into their model registry. Every prediction, model update, and access event was logged and searchable. Explainability tools (SHAP) were used to provide regulators with transparent, case-by-case justifications for credit decisions. This approach not only passed audits but also built trust with customers and stakeholders.
Key Takeaways:
Maintain detailed, immutable logs for all model and data access.
Integrate explainability into monitoring for regulatory compliance.
Ensure audit trails are easily accessible for reviews and investigations.
Case Study 3: Healthcare – Real-Time Incident Response
A healthcare analytics company deployed ML models for patient risk prediction. To ensure patient safety, they set up real-time monitoring of model latency, prediction confidence, and error rates using cloud-native tools (AWS CloudWatch, PagerDuty). When anomalies or performance drops were detected, automated incident response playbooks were triggered, including model rollback and notification of on-call engineers. This minimized downtime and ensured that only validated models influenced clinical decisions.
Key Takeaways:
Set up real-time alerts and automated incident response for critical ML systems.
Monitor latency and confidence, not just accuracy, to catch subtle failures. Enable fast rollback to previous model versions to protect end users.
Best Practices and Common Pitfalls in ML Observability
Implementing observability in MLOps is essential for maintaining reliable, scalable, and trustworthy machine learning systems. However, many teams encounter common pitfalls that can undermine their efforts. Here are the best practices to follow—and the mistakes to avoid—when building observability into your ML models and pipelines.
Best Practices for ML Observability
Monitor the Full ML Lifecycle
Track not just model performance, but also data quality, feature distributions, pipeline health, and infrastructure metrics. Observability should cover data ingestion, preprocessing, training, deployment, and inference.
Automate Metric and Log Collection
Use tools like Prometheus, Grafana, ELK Stack, or cloud-native monitoring to automatically collect and aggregate metrics, logs, and traces from all components of your ML workflow.
Set Up Real-Time Dashboards and Alerts
Visualize key metrics in real time and configure automated alerts for anomalies, drift, or performance drops. This enables rapid detection and response to issues before they impact users or business outcomes.
Integrate Explainability and Auditability
Incorporate explainability tools (e.g., SHAP, LIME) and maintain audit trails for all model predictions and pipeline events. This supports transparency, compliance, and root cause analysis.
Test and Validate Monitoring Pipelines
Regularly simulate failures, drift, and data quality issues to ensure your monitoring and alerting systems work as expected. Include observability checks in your CI/CD pipelines.
Centralize Monitoring Across Environments
Aggregate metrics and logs from on-premises, cloud, and hybrid deployments into unified dashboards. This provides a single source of truth and simplifies troubleshooting.
Document and Communicate
Maintain clear documentation of your observability setup, including monitored metrics, alert thresholds, and incident response procedures. Foster collaboration between data science, engineering, and operations teams.
Common Pitfalls to Avoid
Focusing Only on Model Accuracy:
Ignoring data drift, latency, or infrastructure health can lead to silent failures and degraded user experience.
Alert Fatigue:
Setting thresholds too low or monitoring too many metrics can overwhelm teams with false positives. Tune alerts to focus on actionable issues.
Siloed Monitoring Tools:
Using separate tools for different environments or pipeline stages creates blind spots. Strive for unified, end-to-end observability.
Neglecting Security and Compliance:
Failing to secure monitoring data or maintain audit logs can result in compliance violations and data breaches.
Lack of Continuous Improvement:
Treating observability as a one-time setup, rather than an evolving process, leads to outdated dashboards and missed issues.
Future Trends in ML Observability
As machine learning becomes increasingly central to business operations, the field of ML observability is rapidly evolving. Organizations are seeking more intelligent, automated, and integrated solutions to monitor, troubleshoot, and optimize their ML models and pipelines. Here are the key future trends shaping the next generation of ML observability:
1. AI-Driven and Self-Healing Observability
The future of ML observability will be powered by AI itself. Expect to see more platforms that use machine learning to automatically detect anomalies, predict failures, and even trigger self-healing actions—such as rolling back to a previous model or retraining on fresh data—without human intervention. This will reduce downtime and operational overhead, making ML systems more resilient.
2. Unified Observability Across Hybrid and Multi-Cloud Environments
As organizations adopt hybrid and multi-cloud strategies, observability tools will evolve to provide a single pane of glass across all environments. Centralized dashboards, cross-cloud tracing, and unified alerting will become standard, enabling teams to monitor distributed ML workloads seamlessly, regardless of where they run.
3. Deeper Integration with MLOps and DevOps Pipelines
Observability will become even more tightly integrated with CI/CD, model registry, and deployment workflows. Automated feedback loops will enable continuous monitoring, validation, and improvement of models as part of the standard MLOps lifecycle. This will accelerate the pace of innovation and reduce the risk of undetected issues in production.
4. Real-Time Explainability and Fairness Monitoring
Future observability platforms will offer real-time explainability and bias detection, not just for batch analysis but for every prediction served in production. This will help organizations meet regulatory requirements, build trust with users, and ensure ethical AI practices.
5. Observability for Edge and Federated ML
With the rise of edge computing and federated learning, observability tools will need to support monitoring and troubleshooting of models deployed on remote devices and decentralized data sources. Lightweight, distributed monitoring agents and privacy-preserving analytics will become increasingly important.
6. Automated Compliance and Auditability
Regulatory demands are growing, and observability platforms will automate compliance checks, generate audit reports, and maintain tamper-proof logs for all model and data activities. This will simplify audits and reduce the burden on ML and compliance teams.
7. Cost and Resource Optimization Insights
Next-generation observability will not only track performance and reliability but also provide actionable insights into resource usage and cost optimization. This will help organizations balance performance, reliability, and budget as ML operations scale.
MLOps in Practice – How to Automate the Machine Learning Model Lifecycle
Real-Time Monitoring Strategies for LLMs in MLOps Pipelines
The Future of MLOps: Trends and Innovations in Machine Learning Operations