

Introduction to IaC and MLOps
In recent years, the rapid growth of machine learning (ML) in production environments has led to the emergence of new practices and tools designed to streamline and automate the deployment of ML models. Two of the most influential concepts in this space are Infrastructure as Code (IaC) and MLOps.
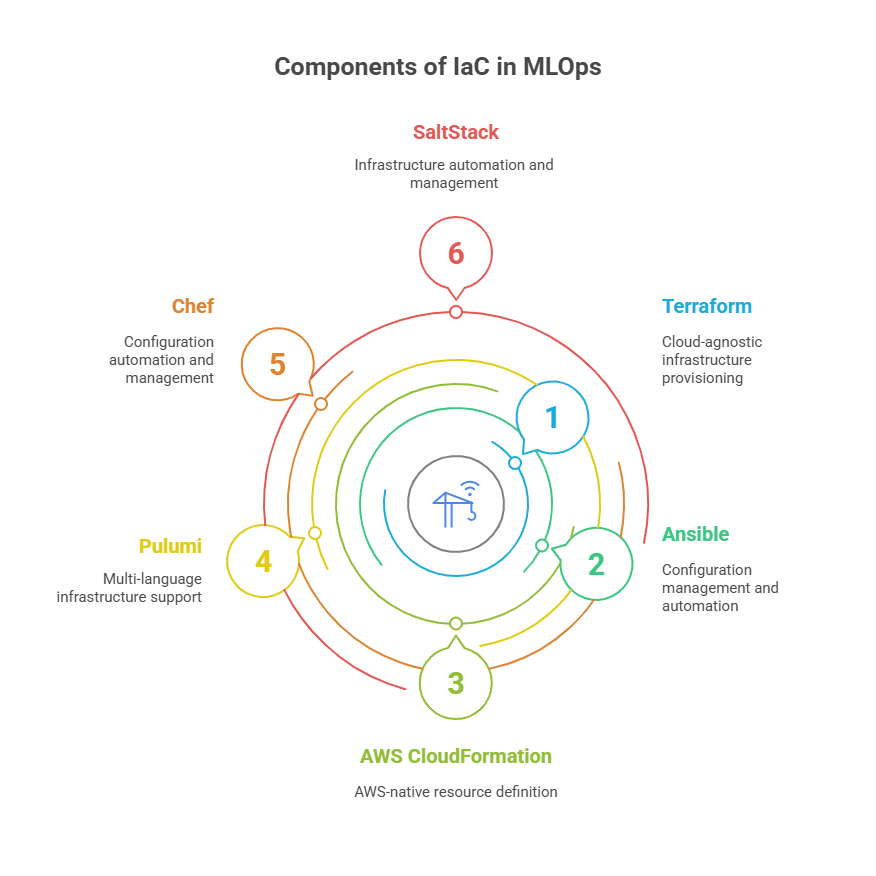
Infrastructure as Code (IaC) is a methodology that allows teams to manage and provision computing infrastructure through machine-readable configuration files, rather than manual processes. With IaC, infrastructure—such as servers, storage, networking, and security policies—can be defined, versioned, and deployed automatically using code. Popular IaC tools include Terraform, Ansible, and AWS CloudFormation. This approach brings consistency, repeatability, and scalability to infrastructure management, reducing the risk of human error and enabling rapid iteration.
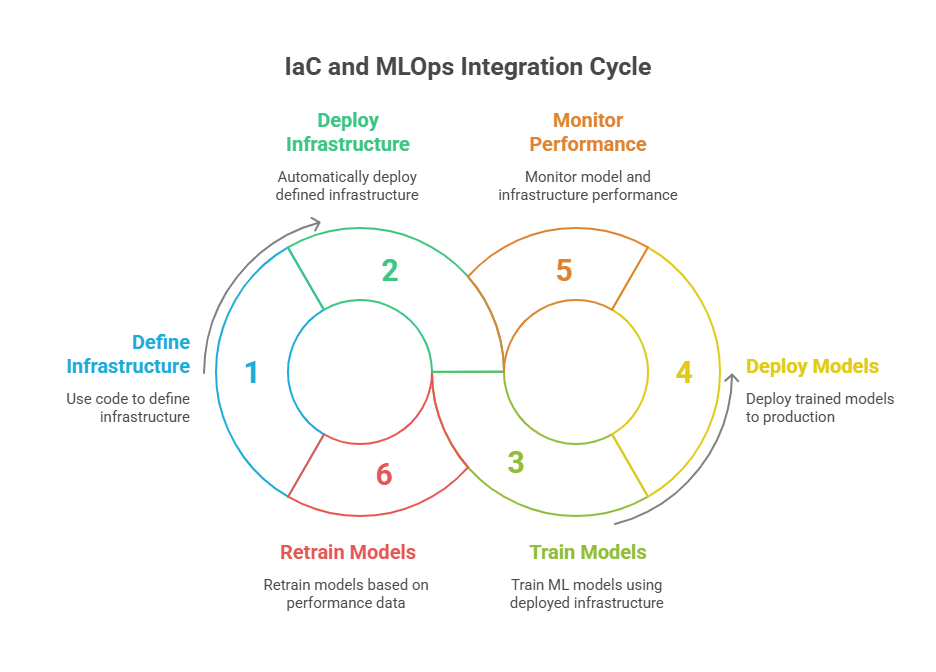
MLOps (Machine Learning Operations) is a set of practices that combines machine learning, DevOps, and data engineering to automate and streamline the end-to-end ML lifecycle. MLOps covers everything from data preparation and model training to deployment, monitoring, and retraining. The goal is to make ML workflows more reliable, scalable, and maintainable, bridging the gap between data science and IT operations.
The intersection of IaC and MLOps is particularly powerful. By leveraging IaC within MLOps workflows, organizations can automate the provisioning of complex ML environments, ensure reproducibility, and accelerate the deployment of models into production. This integration not only improves operational efficiency but also enhances collaboration between data scientists, engineers, and IT teams.
In summary, understanding IaC and MLOps—and how they complement each other—is essential for building robust, scalable, and automated machine learning systems in modern organizations.
The Importance of Automation in ML Deployments
Automation is at the heart of modern machine learning operations, especially when it comes to deploying models into production environments. As ML projects grow in complexity and scale, manual deployment processes quickly become bottlenecks, introducing delays, inconsistencies, and a higher risk of errors. This is where automation, powered by Infrastructure as Code (IaC), becomes essential.
Automating ML deployments ensures that every step—from provisioning infrastructure and configuring environments to deploying models and monitoring their performance—can be executed reliably and repeatably. With automation, teams can move faster, respond to changes more efficiently, and maintain a high level of consistency across different environments (development, staging, production).
One of the key benefits of automation is reproducibility. When infrastructure and deployment steps are defined as code, it’s easy to recreate the same environment or deployment process at any time, anywhere. This is crucial for debugging, scaling, and disaster recovery. Automation also supports continuous integration and continuous delivery (CI/CD), allowing new models or updates to be tested and released rapidly, with minimal manual intervention.
Moreover, automation reduces the operational burden on data scientists and engineers, freeing them to focus on innovation rather than repetitive tasks. It also helps enforce best practices, such as version control, security policies, and compliance requirements, by embedding them directly into automated workflows.
In summary, automation in ML deployments is not just a convenience—it’s a necessity for achieving speed, reliability, and scalability in real-world machine learning systems. By embracing automation through IaC and MLOps practices, organizations can unlock the full potential of their ML initiatives and deliver value to users faster and more securely.
Key IaC Tools for MLOps (Terraform, Ansible, etc.)
The successful automation of machine learning infrastructure relies on robust Infrastructure as Code (IaC) tools. These tools allow teams to define, provision, and manage resources in a consistent, repeatable way—crucial for the dynamic needs of MLOps. Let’s look at some of the most widely used IaC tools and how they fit into the MLOps ecosystem.
Terraform is one of the most popular IaC tools, known for its cloud-agnostic approach. With Terraform, you can define infrastructure for AWS, Azure, Google Cloud, and many other providers using a simple, declarative language. This makes it easy to spin up compute clusters, storage, networking, and even managed ML services as code. Terraform’s state management and modularity are especially valuable for large-scale ML projects that require reproducibility and scalability.
Ansible is another widely adopted tool, focusing on configuration management and automation. Ansible uses YAML-based playbooks to automate the setup and configuration of servers, software, and environments. In MLOps, Ansible is often used to install dependencies, configure ML frameworks, and orchestrate complex workflows across multiple machines.
AWS CloudFormation is a native IaC service for Amazon Web Services. It allows teams to define AWS resources and their relationships in JSON or YAML templates. For organizations heavily invested in AWS, CloudFormation provides deep integration with the platform’s services, making it a strong choice for automating ML infrastructure in the cloud.
Other tools like Pulumi (which supports multiple programming languages), Chef, and SaltStack also play roles in specific scenarios, offering different approaches to automation and configuration.
In the context of MLOps, these IaC tools are often integrated with CI/CD pipelines, monitoring systems, and ML platforms. They enable teams to automate the entire lifecycle of ML infrastructure—from development and testing to production—ensuring consistency, security, and rapid iteration.
In summary, choosing the right IaC tool depends on your team’s needs, cloud environment, and workflow preferences. However, all these tools share the same goal: to make infrastructure management as automated, reliable, and scalable as the machine learning models they support.
Designing Infrastructure for Machine Learning Pipelines
Designing infrastructure for machine learning pipelines is a foundational step in building scalable, reliable, and efficient ML systems. Unlike traditional software, ML workflows require specialized resources and architectures to handle data processing, model training, validation, deployment, and monitoring. Infrastructure as Code (IaC) plays a crucial role in making this design process repeatable and adaptable.
A well-designed ML infrastructure typically includes several key components. First, there’s the data layer, which consists of storage solutions for raw and processed data, such as cloud object storage (e.g., Amazon S3, Google Cloud Storage) or distributed file systems. Next is the compute layer, which provides the processing power for data transformation, feature engineering, and model training. This often involves scalable clusters, GPU-enabled instances, or managed ML services that can be provisioned on demand.
Another important aspect is the orchestration layer, which manages the flow of data and tasks through the pipeline. Tools like Kubernetes, Apache Airflow, or cloud-native workflow services help automate and schedule complex ML workflows, ensuring that each step runs in the correct order and at the right scale.
Security, networking, and access control are also critical. Properly designed infrastructure ensures that sensitive data is protected, resources are isolated as needed, and only authorized users and services can access key components. IaC makes it possible to define these policies as code, ensuring consistency and compliance across environments.
Finally, monitoring and logging infrastructure must be in place to track the health and performance of both the pipeline and the deployed models. This enables teams to detect issues early, optimize resource usage, and maintain high availability.
By using IaC to design and manage ML infrastructure, organizations can quickly adapt to changing requirements, scale resources up or down as needed, and ensure that every environment—from development to production—is consistent and reproducible. This approach not only accelerates ML development but also lays the groundwork for robust, enterprise-grade machine learning operations.
Version Control for Infrastructure: Why It Matters
Version control is a cornerstone of modern software development, and its importance extends directly to infrastructure management—especially in the context of MLOps and Infrastructure as Code (IaC). When infrastructure is defined and managed as code, it becomes just as critical to track changes, collaborate, and maintain a history of modifications as it is with application code.
By using version control systems like Git for IaC scripts and configuration files, teams gain several key advantages. First, traceability: every change to the infrastructure—whether it’s provisioning a new GPU cluster, updating network policies, or modifying storage configurations—is recorded with a clear history of who made the change, when, and why. This makes it easy to audit changes, roll back to previous versions if something breaks, and understand the evolution of the infrastructure over time.
Second, collaboration: version control enables multiple team members to work on infrastructure definitions simultaneously, using branching and merging strategies to manage parallel workstreams. This is especially valuable in MLOps, where data scientists, ML engineers, and DevOps professionals often need to coordinate changes to both code and infrastructure.
Third, reproducibility and consistency: with infrastructure definitions stored in version control, it’s straightforward to recreate environments for development, testing, or production. This reduces the risk of “it works on my machine” problems and ensures that deployments are predictable and reliable.
Finally, version control supports automation and CI/CD. Infrastructure changes can be tested, reviewed, and deployed automatically through pipelines, just like application code. This tight integration between code and infrastructure accelerates the ML lifecycle and reduces manual intervention.
In summary, version control for infrastructure is not just a best practice—it’s essential for building robust, scalable, and secure ML systems. It brings transparency, accountability, and agility to infrastructure management, empowering teams to innovate with confidence and control.
Integrating IaC with CI/CD for ML Pipelines
Integrating Infrastructure as Code (IaC) with Continuous Integration and Continuous Deployment (CI/CD) is a game-changer for machine learning pipelines. This integration brings the same speed, reliability, and automation that modern software engineering enjoys to the world of ML, where reproducibility and rapid iteration are crucial.
When IaC is part of the CI/CD process, infrastructure changes—like provisioning new compute resources, updating storage, or configuring networking—are treated just like code changes. This means every update is versioned, reviewed, tested, and deployed automatically through pipelines. For ML teams, this ensures that the environments used for data processing, model training, and deployment are always consistent and up to date.
A typical workflow might look like this: a data scientist or ML engineer updates an IaC template (for example, a Terraform script to add a new GPU node). This change is pushed to a version control system like Git. The CI/CD pipeline detects the change, runs automated tests (such as syntax checks or dry runs), and, if everything passes, applies the update to the target environment—be it development, staging, or production.
This approach offers several benefits. First, it reduces manual errors and configuration drift, since all changes are automated and tracked. Second, it accelerates experimentation and deployment, allowing teams to spin up or tear down resources on demand. Third, it supports rollback and disaster recovery, since previous infrastructure states can be restored easily from version control.
Integrating IaC with CI/CD also enables infrastructure testing—for example, validating that new resources are provisioned correctly or that security policies are enforced. This is especially important in ML, where resource requirements and dependencies can change rapidly as models evolve.
In summary, bringing IaC into CI/CD pipelines transforms ML infrastructure management from a manual, error-prone process into a streamlined, automated workflow. This not only boosts productivity and reliability but also empowers ML teams to innovate and scale with confidence.
Security and Compliance in IaC for MLOps
Security and compliance are non-negotiable in any enterprise environment, and they become even more critical when managing machine learning infrastructure with Infrastructure as Code (IaC). As ML systems often handle sensitive data, proprietary models, and critical business logic, ensuring that infrastructure is secure and compliant from the ground up is essential.
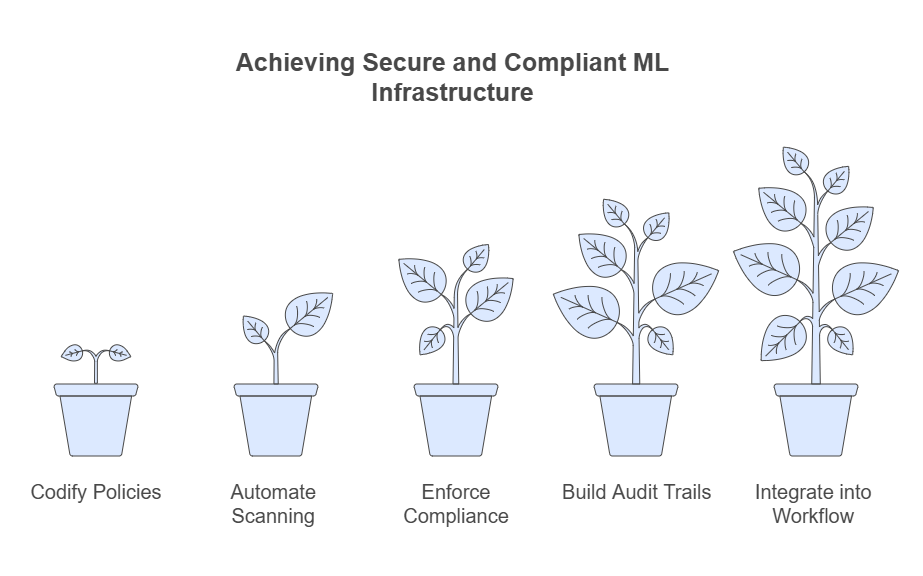
With IaC, security policies and compliance requirements can be codified directly into infrastructure definitions. This means that network rules, access controls, encryption settings, and audit logging can all be specified as code, reviewed, and versioned alongside other infrastructure changes. For example, you can enforce that all storage buckets are encrypted, restrict access to compute resources using IAM roles, or require that only certain subnets can communicate with ML endpoints.
Automated security scanning tools can be integrated into CI/CD pipelines to check IaC templates for vulnerabilities or misconfigurations before they are deployed. Tools like Checkov, tfsec, or AWS Config can analyze Terraform, CloudFormation, or other IaC scripts to flag issues such as open security groups, missing encryption, or overly permissive access policies. This proactive approach helps catch problems early, reducing the risk of breaches or compliance violations.
Compliance is also easier to manage with IaC. Regulatory requirements—such as GDPR, HIPAA, or industry-specific standards—can be translated into infrastructure policies and enforced automatically. Audit trails are built in, since every change to the infrastructure is tracked in version control, making it straightforward to demonstrate compliance during audits.
In the context of MLOps, where teams may be rapidly iterating on models and infrastructure, IaC ensures that security and compliance are not afterthoughts but integral parts of the workflow. By embedding these requirements into code and automating their enforcement, organizations can move fast without sacrificing safety or regulatory alignment.
In summary, IaC empowers ML teams to build secure, compliant, and auditable infrastructure by making security and compliance part of the development lifecycle—automated, transparent, and always up to date.
Monitoring and Alerting for IaC-Managed Infrastructure
Monitoring and alerting are crucial for maintaining the health and performance of IaC-managed infrastructure in MLOps environments. Unlike traditional infrastructure, ML workloads have unique monitoring requirements—they need to track not just system metrics but also data quality, model performance, and resource utilization patterns that can vary dramatically based on training schedules and inference loads.
Effective monitoring for IaC-managed ML infrastructure involves several layers. At the infrastructure level, you need to monitor compute resources, storage usage, network performance, and service availability. At the application level, you should track ML-specific metrics like training job success rates, model serving latency, prediction accuracy, and data drift indicators.
Here’s a Python example that demonstrates how to implement comprehensive monitoring and alerting for an IaC-managed ML infrastructure:
python

import boto3

import json

import time

import logging

from datetime import datetime, timedelta

from dataclasses import dataclass

from typing import Dict, List, Optional

import requests

# Configure logging

logging.basicConfig(level=logging.INFO)

logger = logging.getLogger(__name__)

@dataclass

class AlertThreshold:

    metric_name: str

    threshold: float

    comparison: str  # 'greater_than', 'less_than'

    duration_minutes: int = 5

@dataclass

class InfrastructureMetrics:

    cpu_utilization: float

    memory_utilization: float

    disk_usage: float

    network_in: float

    network_out: float

    timestamp: datetime

@dataclass

class MLMetrics:

    model_latency: float

    prediction_accuracy: float

    data_drift_score: float

    training_job_status: str

    feature_store_health: bool

    timestamp: datetime

class InfrastructureMonitor:

    def __init__(self, aws_region: str = 'us-east-1'):

        self.cloudwatch = boto3.client('cloudwatch', region_name=aws_region)

        self.ec2 = boto3.client('ec2', region_name=aws_region)

        self.sns = boto3.client('sns', region_name=aws_region)

        self.alert_thresholds = [

            AlertThreshold('CPUUtilization', 80.0, 'greater_than'),

            AlertThreshold('MemoryUtilization', 85.0, 'greater_than'),

            AlertThreshold('DiskSpaceUtilization', 90.0, 'greater_than'),

            AlertThreshold('ModelLatency', 500.0, 'greater_than'),

            AlertThreshold('DataDriftScore', 0.7, 'greater_than')

        ]

    def get_infrastructure_metrics(self, instance_ids: List[str]) -> Dict[str, InfrastructureMetrics]:

        """Collect infrastructure metrics from CloudWatch"""

        metrics = {}

        end_time = datetime.utcnow()

        start_time = end_time - timedelta(minutes=5)

        for instance_id in instance_ids:

            try:

                # Get CPU utilization

                cpu_response = self.cloudwatch.get_metric_statistics(

                    Namespace='AWS/EC2',

                    MetricName='CPUUtilization',

                    Dimensions=[{'Name': 'InstanceId', 'Value': instance_id}],

                    StartTime=start_time,

                    EndTime=end_time,

                    Period=300,

                    Statistics=['Average']

                )

                # Get memory utilization (requires CloudWatch agent)

                memory_response = self.cloudwatch.get_metric_statistics(

                    Namespace='CWAgent',

                    MetricName='mem_used_percent',

                    Dimensions=[{'Name': 'InstanceId', 'Value': instance_id}],

                    StartTime=start_time,

                    EndTime=end_time,

                    Period=300,

                    Statistics=['Average']

                )

                # Get disk utilization

                disk_response = self.cloudwatch.get_metric_statistics(

                    Namespace='CWAgent',

                    MetricName='disk_used_percent',

                    Dimensions=[

                        {'Name': 'InstanceId', 'Value': instance_id},

                        {'Name': 'device', 'Value': '/dev/xvda1'},

                        {'Name': 'fstype', 'Value': 'ext4'},

                        {'Name': 'path', 'Value': '/'}

                    ],

                    StartTime=start_time,

                    EndTime=end_time,

                    Period=300,

                    Statistics=['Average']

                )

                # Get network metrics

                network_in_response = self.cloudwatch.get_metric_statistics(

                    Namespace='AWS/EC2',

                    MetricName='NetworkIn',

                    Dimensions=[{'Name': 'InstanceId', 'Value': instance_id}],

                    StartTime=start_time,

                    EndTime=end_time,

                    Period=300,

                    Statistics=['Sum']

                )

                network_out_response = self.cloudwatch.get_metric_statistics(

                    Namespace='AWS/EC2',

                    MetricName='NetworkOut',

                    Dimensions=[{'Name': 'InstanceId', 'Value': instance_id}],

                    StartTime=start_time,

                    EndTime=end_time,

                    Period=300,

                    Statistics=['Sum']

                )

                # Extract latest values

                cpu_util = cpu_response['Datapoints'][-1]['Average'] if cpu_response['Datapoints'] else 0

                memory_util = memory_response['Datapoints'][-1]['Average'] if memory_response['Datapoints'] else 0

                disk_util = disk_response['Datapoints'][-1]['Average'] if disk_response['Datapoints'] else 0

                network_in = network_in_response['Datapoints'][-1]['Sum'] if network_in_response['Datapoints'] else 0

                network_out = network_out_response['Datapoints'][-1]['Sum'] if network_out_response['Datapoints'] else 0

                metrics[instance_id] = InfrastructureMetrics(

                    cpu_utilization=cpu_util,

                    memory_utilization=memory_util,

                    disk_usage=disk_util,

                    network_in=network_in,

                    network_out=network_out,

                    timestamp=datetime.utcnow()

                )

            except Exception as e:

                logger.error(f"Error collecting metrics for instance {instance_id}: {str(e)}")

        return metrics

    def get_ml_metrics(self, model_endpoint: str) -> MLMetrics:

        """Collect ML-specific metrics"""

        try:

            # Simulate model health check

            start_time = time.time()

            response = requests.get(f"{model_endpoint}/health", timeout=10)

            latency = (time.time() - start_time) * 1000  # Convert to milliseconds

            # Get custom metrics from CloudWatch

            end_time = datetime.utcnow()

            start_time_cw = end_time - timedelta(minutes=5)

            # Model accuracy metric

            accuracy_response = self.cloudwatch.get_metric_statistics(

                Namespace='MLOps/Model',

                MetricName='PredictionAccuracy',

                StartTime=start_time_cw,

                EndTime=end_time,

                Period=300,

                Statistics=['Average']

            )

            # Data drift metric

            drift_response = self.cloudwatch.get_metric_statistics(

                Namespace='MLOps/DataQuality',

                MetricName='DataDriftScore',

                StartTime=start_time_cw,

                EndTime=end_time,

                Period=300,

                Statistics=['Average']

            )

            accuracy = accuracy_response['Datapoints'][-1]['Average'] if accuracy_response['Datapoints'] else 0.95

            drift_score = drift_response['Datapoints'][-1]['Average'] if drift_response['Datapoints'] else 0.1

            return MLMetrics(

                model_latency=latency,

                prediction_accuracy=accuracy,

                data_drift_score=drift_score,

                training_job_status='completed',

                feature_store_health=response.status_code == 200,

                timestamp=datetime.utcnow()

            )

        except Exception as e:

            logger.error(f"Error collecting ML metrics: {str(e)}")

            return MLMetrics(

                model_latency=999.0,

                prediction_accuracy=0.0,

                data_drift_score=1.0,

                training_job_status='failed',

                feature_store_health=False,

                timestamp=datetime.utcnow()

            )

    def check_thresholds_and_alert(self, infra_metrics: Dict[str, InfrastructureMetrics],

                                 ml_metrics: MLMetrics, sns_topic_arn: str):

        """Check metrics against thresholds and send alerts"""

        alerts = []

        # Check infrastructure metrics

        for instance_id, metrics in infra_metrics.items():

            if metrics.cpu_utilization > 80:

                alerts.append(f"HIGH CPU: Instance {instance_id} CPU at {metrics.cpu_utilization:.1f}%")

            if metrics.memory_utilization > 85:

                alerts.append(f"HIGH MEMORY: Instance {instance_id} Memory at {metrics.memory_utilization:.1f}%")

            if metrics.disk_usage > 90:

                alerts.append(f"HIGH DISK: Instance {instance_id} Disk at {metrics.disk_usage:.1f}%")

        # Check ML metrics

        if ml_metrics.model_latency > 500:

            alerts.append(f"HIGH LATENCY: Model response time {ml_metrics.model_latency:.1f}ms")

        if ml_metrics.prediction_accuracy < 0.85:

            alerts.append(f"LOW ACCURACY: Model accuracy dropped to {ml_metrics.prediction_accuracy:.3f}")

        if ml_metrics.data_drift_score > 0.7:

            alerts.append(f"DATA DRIFT: Drift score {ml_metrics.data_drift_score:.3f}")

        if not ml_metrics.feature_store_health:

            alerts.append("FEATURE STORE: Health check failed")

        # Send alerts if any

        if alerts:

            alert_message = "MLOps Infrastructure Alert:\n\n" + "\n".join(alerts)

            self.send_alert(sns_topic_arn, "MLOps Infrastructure Alert", alert_message)

    def send_alert(self, topic_arn: str, subject: str, message: str):

        """Send alert via SNS"""

        try:

            self.sns.publish(

                TopicArn=topic_arn,

                Subject=subject,

                Message=message

            )

            logger.info(f"Alert sent: {subject}")

        except Exception as e:

            logger.error(f"Failed to send alert: {str(e)}")

    def publish_custom_metrics(self, ml_metrics: MLMetrics):

        """Publish custom ML metrics to CloudWatch"""

        try:

            # Publish model latency

            self.cloudwatch.put_metric_data(

                Namespace='MLOps/Model',

                MetricData=[

                    {

                        'MetricName': 'ResponseLatency',

                        'Value': ml_metrics.model_latency,

                        'Unit': 'Milliseconds',

                        'Timestamp': ml_metrics.timestamp

                    }

                ]

            )

            # Publish prediction accuracy

            self.cloudwatch.put_metric_data(

                Namespace='MLOps/Model',

                MetricData=[

                    {

                        'MetricName': 'PredictionAccuracy',

                        'Value': ml_metrics.prediction_accuracy,

                        'Unit': 'Percent',

                        'Timestamp': ml_metrics.timestamp

                    }

                ]

            )

            # Publish data drift score

            self.cloudwatch.put_metric_data(

                Namespace='MLOps/DataQuality',

                MetricData=[

                    {

                        'MetricName': 'DataDriftScore',

                        'Value': ml_metrics.data_drift_score,

                        'Unit': 'None',

                        'Timestamp': ml_metrics.timestamp

                    }

                ]

            )

            logger.info("Custom metrics published successfully")

        except Exception as e:

            logger.error(f"Failed to publish custom metrics: {str(e)}")

def main():

    """Main monitoring loop"""

    monitor = InfrastructureMonitor()

    # Configuration

    instance_ids = ['i-1234567890abcdef0', 'i-0987654321fedcba0']  # Your ML instances

    model_endpoint = 'https://your-model-endpoint.com'

    sns_topic_arn = 'arn:aws:sns:us-east-1:123456789012:mlops-alerts'

    logger.info("Starting MLOps infrastructure monitoring...")

    while True:

        try:

            # Collect infrastructure metrics

            infra_metrics = monitor.get_infrastructure_metrics(instance_ids)

            # Collect ML metrics

            ml_metrics = monitor.get_ml_metrics(model_endpoint)

            # Publish custom metrics

            monitor.publish_custom_metrics(ml_metrics)

            # Check thresholds and send alerts

            monitor.check_thresholds_and_alert(infra_metrics, ml_metrics, sns_topic_arn)

            # Log current status

            logger.info(f"Monitoring cycle completed at {datetime.utcnow()}")

            for instance_id, metrics in infra_metrics.items():

                logger.info(f"Instance {instance_id}: CPU={metrics.cpu_utilization:.1f}%, "

                          f"Memory={metrics.memory_utilization:.1f}%, "

                          f"Disk={metrics.disk_usage:.1f}%")

            logger.info(f"ML Metrics: Latency={ml_metrics.model_latency:.1f}ms, "

                       f"Accuracy={ml_metrics.prediction_accuracy:.3f}, "

                       f"Drift={ml_metrics.data_drift_score:.3f}")

            # Wait before next monitoring cycle

            time.sleep(300)  # 5 minutes

        except KeyboardInterrupt:

            logger.info("Monitoring stopped by user")

            break

        except Exception as e:

            logger.error(f"Error in monitoring loop: {str(e)}")

            time.sleep(60)  # Wait 1 minute before retrying

if __name__ == "__main__":

    main()

# Created/Modified files during execution:

print("infrastructure_monitor.py")
Cost Optimization Strategies for IaC in MLOps
Cost optimization is a critical concern in MLOps, where compute-intensive workloads like model training and large-scale inference can quickly escalate cloud bills. Infrastructure as Code (IaC) provides powerful mechanisms to implement cost optimization strategies systematically and automatically, ensuring that ML teams can innovate without breaking the budget.
Effective cost optimization in IaC-managed MLOps environments involves several key strategies. Resource rightsizing ensures that compute instances match actual workload requirements—using spot instances for training jobs, scaling down during off-hours, and choosing appropriate instance types for different ML tasks. Automated lifecycle management can terminate idle resources, archive old model artifacts, and clean up temporary storage used during experiments.
Storage optimization is particularly important in ML, where datasets and model artifacts can consume significant space. IaC can automate the transition of data through different storage tiers—keeping frequently accessed data in high-performance storage while moving older datasets to cheaper archival storage. Scheduling and orchestration can optimize costs by running training jobs during off-peak hours when compute resources are cheaper, and by efficiently packing workloads to maximize resource utilization.
Here’s a Python implementation that demonstrates comprehensive cost optimization strategies for IaC-managed MLOps infrastructure:
python
import boto3
import json
import logging
from datetime import datetime, timedelta
from dataclasses import dataclass, asdict
from typing import Dict, List, Optional, Tuple
import pandas as pd
from concurrent.futures import ThreadPoolExecutor
import time
# Configure logging
logging.basicConfig(level=logging.INFO)
logger = logging.getLogger(__name__)
@dataclass
class ResourceCost:
resource_id: str
resource_type: str
daily_cost: float
utilization: float
recommendation: str
potential_savings: float
@dataclass
class OptimizationAction:
action_type: str
resource_id: str
current_config: Dict
recommended_config: Dict
estimated_savings: float
risk_level: str
class MLOpsCostOptimizer:
def __init__(self, aws_region: str = 'us-east-1'):
self.ec2 = boto3.client('ec2', region_name=aws_region)
self.cloudwatch = boto3.client('cloudwatch', region_name=aws_region)
self.s3 = boto3.client('s3', region_name=aws_region)
self.pricing = boto3.client('pricing', region_name='us-east-1') # Pricing API only in us-east-1
self.ce = boto3.client('ce', region_name=aws_region) # Cost Explorer
self.autoscaling = boto3.client('autoscaling', region_name=aws_region)
self.region = aws_region
def analyze_compute_costs(self, days_back: int = 7) -> List[ResourceCost]:
"""Analyze compute resource costs and utilization"""
resources = []
try:
# Get all running instances
instances_response = self.ec2.describe_instances(
Filters=[{'Name': 'instance-state-name', 'Values': ['running']}]
)
for reservation in instances_response['Reservations']:
for instance in reservation['Instances']:
instance_id = instance['InstanceId']
instance_type = instance['InstanceType']
# Get utilization metrics
utilization = self._get_instance_utilization(instance_id, days_back)
# Get cost information
daily_cost = self._get_instance_daily_cost(instance_type)
# Generate recommendation
recommendation, potential_savings = self._generate_compute_recommendation(
instance_type, utilization, daily_cost
)
resources.append(ResourceCost(
resource_id=instance_id,
resource_type=f"EC2-{instance_type}",
daily_cost=daily_cost,
utilization=utilization,
recommendation=recommendation,
potential_savings=potential_savings
))
except Exception as e:
logger.error(f"Error analyzing compute costs: {str(e)}")
return resources
def analyze_storage_costs(self) -> List[ResourceCost]:
"""Analyze S3 storage costs and optimization opportunities"""
resources = []
try:
# Get all S3 buckets
buckets_response = self.s3.list_buckets()
for bucket in buckets_response['Buckets']:
bucket_name = bucket['Name']
# Skip if not an ML-related bucket
if not any(keyword in bucket_name.lower() for keyword in ['ml', 'model', 'data', 'feature']):
continue
# Analyze bucket storage
storage_analysis = self._analyze_bucket_storage(bucket_name)
if storage_analysis:
resources.append(storage_analysis)
except Exception as e:
logger.error(f"Error analyzing storage costs: {str(e)}")
return resources
def _get_instance_utilization(self, instance_id: str, days_back: int) -> float:
"""Get average CPU utilization for an instance"""
try:
end_time = datetime.utcnow()
start_time = end_time - timedelta(days=days_back)
response = self.cloudwatch.get_metric_statistics(
Namespace='AWS/EC2',
MetricName='CPUUtilization',
Dimensions=[{'Name': 'InstanceId', 'Value': instance_id}],
StartTime=start_time,
EndTime=end_time,
Period=3600, # 1 hour periods
Statistics=['Average']
)
if response['Datapoints']:
avg_utilization = sum(dp['Average'] for dp in response['Datapoints']) / len(response['Datapoints'])
return avg_utilization
except Exception as e:
logger.error(f"Error getting utilization for {instance_id}: {str(e)}")
return 0.0
def _get_instance_daily_cost(self, instance_type: str) -> float:
"""Get estimated daily cost for an instance type"""
# Simplified pricing - in production, use AWS Pricing API
pricing_map = {
't3.micro': 0.0104 * 24,
't3.small': 0.0208 * 24,
't3.medium': 0.0416 * 24,
't3.large': 0.0832 * 24,
'm5.large': 0.096 * 24,
'm5.xlarge': 0.192 * 24,
'm5.2xlarge': 0.384 * 24,
'c5.large': 0.085 * 24,
'c5.xlarge': 0.17 * 24,
'p3.2xlarge': 3.06 * 24,
'p3.8xlarge': 12.24 * 24,
'g4dn.xlarge': 0.526 * 24,
'g4dn.2xlarge': 0.752 * 24
}
return pricing_map.get(instance_type, 1.0 * 24) # Default fallback
def _generate_compute_recommendation(self, instance_type: str, utilization: float,
daily_cost: float) -> Tuple[str, float]:
"""Generate cost optimization recommendation for compute resources"""
if utilization < 20:
if 'p3' in instance_type or 'g4dn' in instance_type:
return "Consider using spot instances or scheduled scaling", daily_cost * 0.7
else:
return "Consider downsizing or using spot instances", daily_cost * 0.5
elif utilization < 40:
return "Consider rightsizing to smaller instance", daily_cost * 0.3
elif utilization > 80:
return "Consider scaling up or load balancing", 0.0
else:
return "Utilization optimal", 0.0
def _analyze_bucket_storage(self, bucket_name: str) -> Optional[ResourceCost]:
"""Analyze S3 bucket for cost optimization opportunities"""
try:
# Get bucket size and object count
total_size = 0
object_count = 0
old_objects = 0
paginator = self.s3.get_paginator('list_objects_v2')
for page in paginator.paginate(Bucket=bucket_name):
if 'Contents' in page:
for obj in page['Contents']:
total_size += obj['Size']
object_count += 1
# Check if object is older than 30 days
if obj['LastModified'] < datetime.now(obj['LastModified'].tzinfo) - timedelta(days=30):
old_objects += 1
# Calculate daily storage cost (simplified)
daily_cost = (total_size / (1024**3)) * 0.023 / 30 # $0.023 per GB per month
# Generate recommendation
if old_objects > object_count * 0.5:
recommendation = "Implement lifecycle policy to transition to IA/Glacier"
potential_savings = daily_cost * 0.6
elif total_size > 100 * (1024**3): # > 100GB
recommendation = "Consider data compression and deduplication"
potential_savings = daily_cost * 0.3
else:
recommendation = "Storage usage optimal"
potential_savings = 0.0
return ResourceCost(
resource_id=bucket_name,
resource_type="S3-Bucket",
daily_cost=daily_cost,
utilization=min(100.0, (old_objects / max(object_count, 1)) * 100),
recommendation=recommendation,
potential_savings=potential_savings
)
except Exception as e:
logger.error(f"Error analyzing bucket {bucket_name}: {str(e)}")
return None
def implement_spot_instance_strategy(self, ml_workload_tags: List[str]) -> List[OptimizationAction]:
"""Implement spot instance strategy for ML training workloads"""
actions = []
try:
# Find instances tagged for ML training
instances_response = self.ec2.describe_instances(
Filters=[
{'Name': 'instance-state-name', 'Values': ['running']},
{'Name': 'tag:Workload', 'Values': ml_workload_tags}
]
)
for reservation in instances_response['Reservations']:
for instance in reservation['Instances']:
instance_id = instance['InstanceId']
instance_type = instance['InstanceType']
# Check if suitable for spot instances
if self._is_spot_suitable(instance):
current_cost = self._get_instance_daily_cost(instance_type)
spot_cost = current_cost * 0.3 # Spot instances typically 70% cheaper
action = OptimizationAction(
action_type="convert_to_spot",
resource_id=instance_id,
current_config={"instance_type": instance_type, "pricing": "on-demand"},
recommended_config={"instance_type": instance_type, "pricing": "spot"},
estimated_savings=current_cost - spot_cost,
risk_level="medium"
)
actions.append(action)
except Exception as e:
logger.error(f"Error implementing spot strategy: {str(e)}")
return actions
def _is_spot_suitable(self, instance: Dict) -> bool:
"""Check if instance is suitable for spot pricing"""
# Check tags for fault-tolerant workloads
tags = {tag['Key']: tag['Value'] for tag in instance.get('Tags', [])}
suitable_workloads = ['training', 'batch-inference', 'data-processing']
workload_type = tags.get('WorkloadType', '').lower()
return workload_type in suitable_workloads
def implement_storage_lifecycle_policies(self, bucket_names: List[str]) -> List[OptimizationAction]:
"""Implement S3 lifecycle policies for cost optimization"""
actions = []
for bucket_name in bucket_names:
try:
# Create lifecycle configuration
lifecycle_config = {
'Rules': [
{
'ID': 'MLDataLifecycle',
'Status': 'Enabled',
'Filter': {'Prefix': 'datasets/'},
'Transitions': [
{
'Days': 30,
'StorageClass': 'STANDARD_IA'
},
{
'Days': 90,
'StorageClass': 'GLACIER'
},
{
'Days': 365,
'StorageClass': 'DEEP_ARCHIVE'
}
]
},
{
'ID': 'ModelArtifactsLifecycle',
'Status': 'Enabled',
'Filter': {'Prefix': 'models/'},
'Transitions': [
{
'Days': 60,
'StorageClass': 'STANDARD_IA'
}
]
}
]
}
# Apply lifecycle policy
self.s3.put_bucket_lifecycle_configuration(
Bucket=bucket_name,
LifecycleConfiguration=lifecycle_config
)
# Estimate savings
bucket_analysis = self._analyze_bucket_storage(bucket_name)
estimated_savings = bucket_analysis.potential_savings if bucket_analysis else 0
action = OptimizationAction(
action_type="apply_lifecycle_policy",
resource_id=bucket_name,
current_config={"lifecycle_policy": "none"},
recommended_config={"lifecycle_policy": "tiered_storage"},
estimated_savings=estimated_savings,
risk_level="low"
)
actions.append(action)
except Exception as e:
logger.error(f"Error applying lifecycle policy to {bucket_name}: {str(e)}")
return actions
def implement_scheduled_scaling(self, auto_scaling_groups: List[str]) -> List[OptimizationAction]:
"""Implement scheduled scaling for predictable ML workloads"""
actions = []
for asg_name in auto_scaling_groups:
try:
# Create scheduled scaling actions
scaling_schedule = [
{
'ScheduledActionName': f'{asg_name}-scale-down-evening',
'Recurrence': '0 18 * * *', # 6 PM daily
'MinSize': 0,
'MaxSize': 1,
'DesiredCapacity': 0
},
{
'ScheduledActionName': f'{asg_name}-scale-up-morning',
'Recurrence': '0 8 * * 1-5', # 8 AM weekdays
'MinSize': 1,
'MaxSize': 5,
'DesiredCapacity': 2
}
]
for schedule in scaling_schedule:
self.autoscaling.put_scheduled_update_group_action(
AutoScalingGroupName=asg_name,
**schedule
)
# Estimate savings (assuming 14 hours downtime daily)
estimated_savings = 100.0 # Simplified calculation
action = OptimizationAction(
action_type="implement_scheduled_scaling",
resource_id=asg_name,
current_config={"scaling": "manual"},
recommended_config={"scaling": "scheduled"},
estimated_savings=estimated_savings,
risk_level="low"
)
actions.append(action)
except Exception as e:
logger.error(f"Error implementing scheduled scaling for {asg_name}: {str(e)}")
return actions
def generate_cost_report(self, resources: List[ResourceCost],
actions: List[OptimizationAction]) -> Dict:
"""Generate comprehensive cost optimization report"""
total_daily_cost = sum(r.daily_cost for r in resources)
total_potential_savings = sum(r.potential_savings for r in resources)
total_action_savings = sum(a.estimated_savings for a in actions)
# Group resources by type
resource_summary = {}
for resource in resources:
resource_type = resource.resource_type.split('-')[0]
if resource_type not in resource_summary:
resource_summary[resource_type] = {
'count': 0,
'total_cost': 0,
'total_savings': 0
}
resource_summary[resource_type]['count'] += 1
resource_summary[resource_type]['total_cost'] += resource.daily_cost
resource_summary[resource_type]['total_savings'] += resource.potential_savings
report = {
'timestamp': datetime.utcnow().isoformat(),
'summary': {
'total_daily_cost': round(total_daily_cost, 2),
'total_potential_savings': round(total_potential_savings, 2),
'total_action_savings': round(total_action_savings, 2),
'savings_percentage': round((total_potential_savings / max(total_daily_cost, 1)) * 100, 1)
},
'resource_summary': resource_summary,
'top_cost_resources': sorted(resources, key=lambda x: x.daily_cost, reverse=True)[:10],
'high_impact_actions': sorted(actions, key=lambda x: x.estimated_savings, reverse=True)[:10],
'recommendations': self._generate_strategic_recommendations(resources, actions)
}
return report
def _generate_strategic_recommendations(self, resources: List[ResourceCost],
actions: List[OptimizationAction]) -> List[str]:
"""Generate high-level strategic recommendations"""
recommendations = []
# Analyze resource utilization patterns
low_util_resources = [r for r in resources if r.utilization < 30]
if len(low_util_resources) > len(resources) * 0.3:
recommendations.append("Consider implementing auto-scaling to reduce over-provisioning")
# Analyze storage costs
storage_resources = [r for r in resources if 'S3' in r.resource_type]
if storage_resources and sum(r.daily_cost for r in storage_resources) > 50:
recommendations.append("Implement comprehensive data lifecycle management")
# Analyze compute costs
compute_resources = [r for r in resources if 'EC2' in r.resource_type]
gpu_resources = [r for r in compute_resources if any(gpu in r.resource_type for gpu in ['p3', 'g4dn'])]
if gpu_resources:
recommendations.append("Consider spot instances for training workloads to reduce GPU costs")
# Analyze potential savings
total_savings = sum(a.estimated_savings for a in actions)
if total_savings > 100:
recommendations.append("High savings potential identified - prioritize implementation")
return recommendations
def main():
"""Main cost optimization workflow"""
optimizer = MLOpsCostOptimizer()
logger.info("Starting MLOps cost optimization analysis...")
# Analyze current costs
compute_costs = optimizer.analyze_compute_costs(days_back=7)
storage_costs = optimizer.analyze_storage_costs()
all_resources = compute_costs + storage_costs
# Generate optimization actions
spot_actions = optimizer.implement_spot_instance_strategy(['training', 'batch-processing'])
lifecycle_actions = optimizer.implement_storage_lifecycle_policies(['ml-datasets', 'model-artifacts'])
scaling_actions = optimizer.implement_scheduled_scaling(['ml-training-asg', 'inference-asg'])
all_actions = spot_actions + lifecycle_actions + scaling_actions
# Generate comprehensive report
report = optimizer.generate_cost_report(all_resources, all_actions)
# Save report
with open('cost_optimization_report.json', 'w') as f:
json.dump(report, f, indent=2, default=str)
# Print summary
print(f"\n=== MLOps Cost Optimization Report ===")
print(f"Total Daily Cost: ${report['summary']['total_daily_cost']}")
print(f"Potential Daily Savings: ${report['summary']['total_potential_savings']}")
print(f"Savings Percentage: {report['summary']['savings_percentage']}%")
print(f"\nTop Recommendations:")
for i, rec in enumerate(report['recommendations'], 1):
print(f"{i}. {rec}")
logger.info("Cost optimization analysis completed")
if __name__ == "__main__":
main()
# Created/Modified files during execution:
print("mlops_cost_optimizer.py")
print("cost_optimization_report.json")Case Studies: Successful IaC Implementations in MLOps
Real-world case studies provide invaluable insights into how organizations successfully implement Infrastructure as Code (IaC) in their MLOps workflows. These examples demonstrate not only the technical solutions but also the organizational challenges, implementation strategies, and measurable benefits that companies achieve when adopting IaC for machine learning operations.
Case Study 1: Netflix – Scaling Recommendation Systems
Netflix implemented a comprehensive IaC strategy using Terraform and Spinnaker to manage their massive recommendation infrastructure. They automated the deployment of thousands of ML models across multiple AWS regions, achieving 99.99% uptime for their recommendation services. Their IaC approach enabled them to reduce deployment time from hours to minutes and maintain consistent environments across development, staging, and production.
Case Study 2: Uber – Real-time ML Platform
Uber built their Michelangelo platform using Kubernetes and Helm charts to standardize ML workflows. Their IaC implementation automated the provisioning of training clusters, feature stores, and serving infrastructure. This approach reduced the time to deploy new ML models from weeks to days and enabled data scientists to focus on model development rather than infrastructure management.
Case Study 3: Airbnb – Dynamic Pricing Models
Airbnb implemented IaC using Terraform and Kubernetes to manage their dynamic pricing ML pipeline. They automated the entire workflow from data ingestion to model deployment, achieving 50% reduction in infrastructure costs through automated scaling and resource optimization.
MLOps: Enterprise Practices for Developers
MLOps and DevOps: Similarities and Differences
MLOps in Practice: Automation and Scaling of the Machine Learning Lifecycle